.png)
Weekly Snapshot
- BTC: US $68,926 (-2.9%)
- ETH: US $2,087 (+0.0%)
- Crypto Market Cap: US $2.35T (-2.3%)
- Gold: US $4,503/oz (-10.3%)
- S&P 500: 6,506 (-2.4%)
- ASX 200: 8,428 (-2.3%)
Executive Summary
- Surging oil prices and the potential for higher rates and a strengthening dollar triggered a sharp correction across both gold and equities, with gold crashing more than 10% while stock markets and bitcoin fell 2–3%, less than traditional safe havens amid the escalating Iran conflict.
- The SEC and CFTC jointly classified 16 major crypto assets, including Bitcoin, Ethereum and Solana, as digital commodities rather than securities, the most significant regulatory clarity the U.S. crypto industry has received in over a decade.
- Strategy purchased a record 22,337 BTC for US $1.57 billion in a single week, bringing its total holdings to 761,068 BTC, roughly 3.6% of Bitcoin's total supply.
- AI tokens posted their strongest week in months, led by Bittensor (TAO) surging 55%, as decentralised GPU marketplaces position themselves as lower-cost alternatives to hyperscale cloud providers amid a global compute shortage.
Oil Spikes, Dollar Strengthens, Gold Crashes 10% & Bitcoin Holds Its Ground
It's been a brutal week for traditional markets. Gold slid more than 10% while digital assets and stock markets fell 2-3% on the continued conflict in the Middle East. Dubai oil prices surged above US $136 per barrel as Iran intensified strikes on regional energy infrastructure.
State owned QatarEnergy, the world's largest supplier of liquified natural gas (LNG) noted that 17% of its export capacity would be offline for between 3-5 years following strikes from Iran.
Trump recently took to social media to say that if the Strait of Hormuz doesn't re-open without threat in the next 48 hours, America will 'obliterate' Iran's various nuclear power plants.

Implications for investors
The conflict in Iran matters because energy prices have a direct cost impact on every sector of the economy; transportation, manufacturing, data centres, groceries etc. As energy prices rise, capital is often pulled from financial assets (gold, stocks, bitcoin) and used to pay for living / operating costs.
As a byproduct, when prices rise (inflation), central banks and governments have a few blunt tools at their disposal to bring inflation down. Governments can cut spending (austerity) and central banks can increase interest rates and reduce bond purchases (quantitative tightening).
When rates rise, the knock on impact of highly indebted countries can make the economic situation worse not better. National debt repayments increase as interest rates rise, consumers with mortgages and businesses with interest rate sensitive debt cut back on spending which in turn impacts more businesses and employment in a vicious cycle.
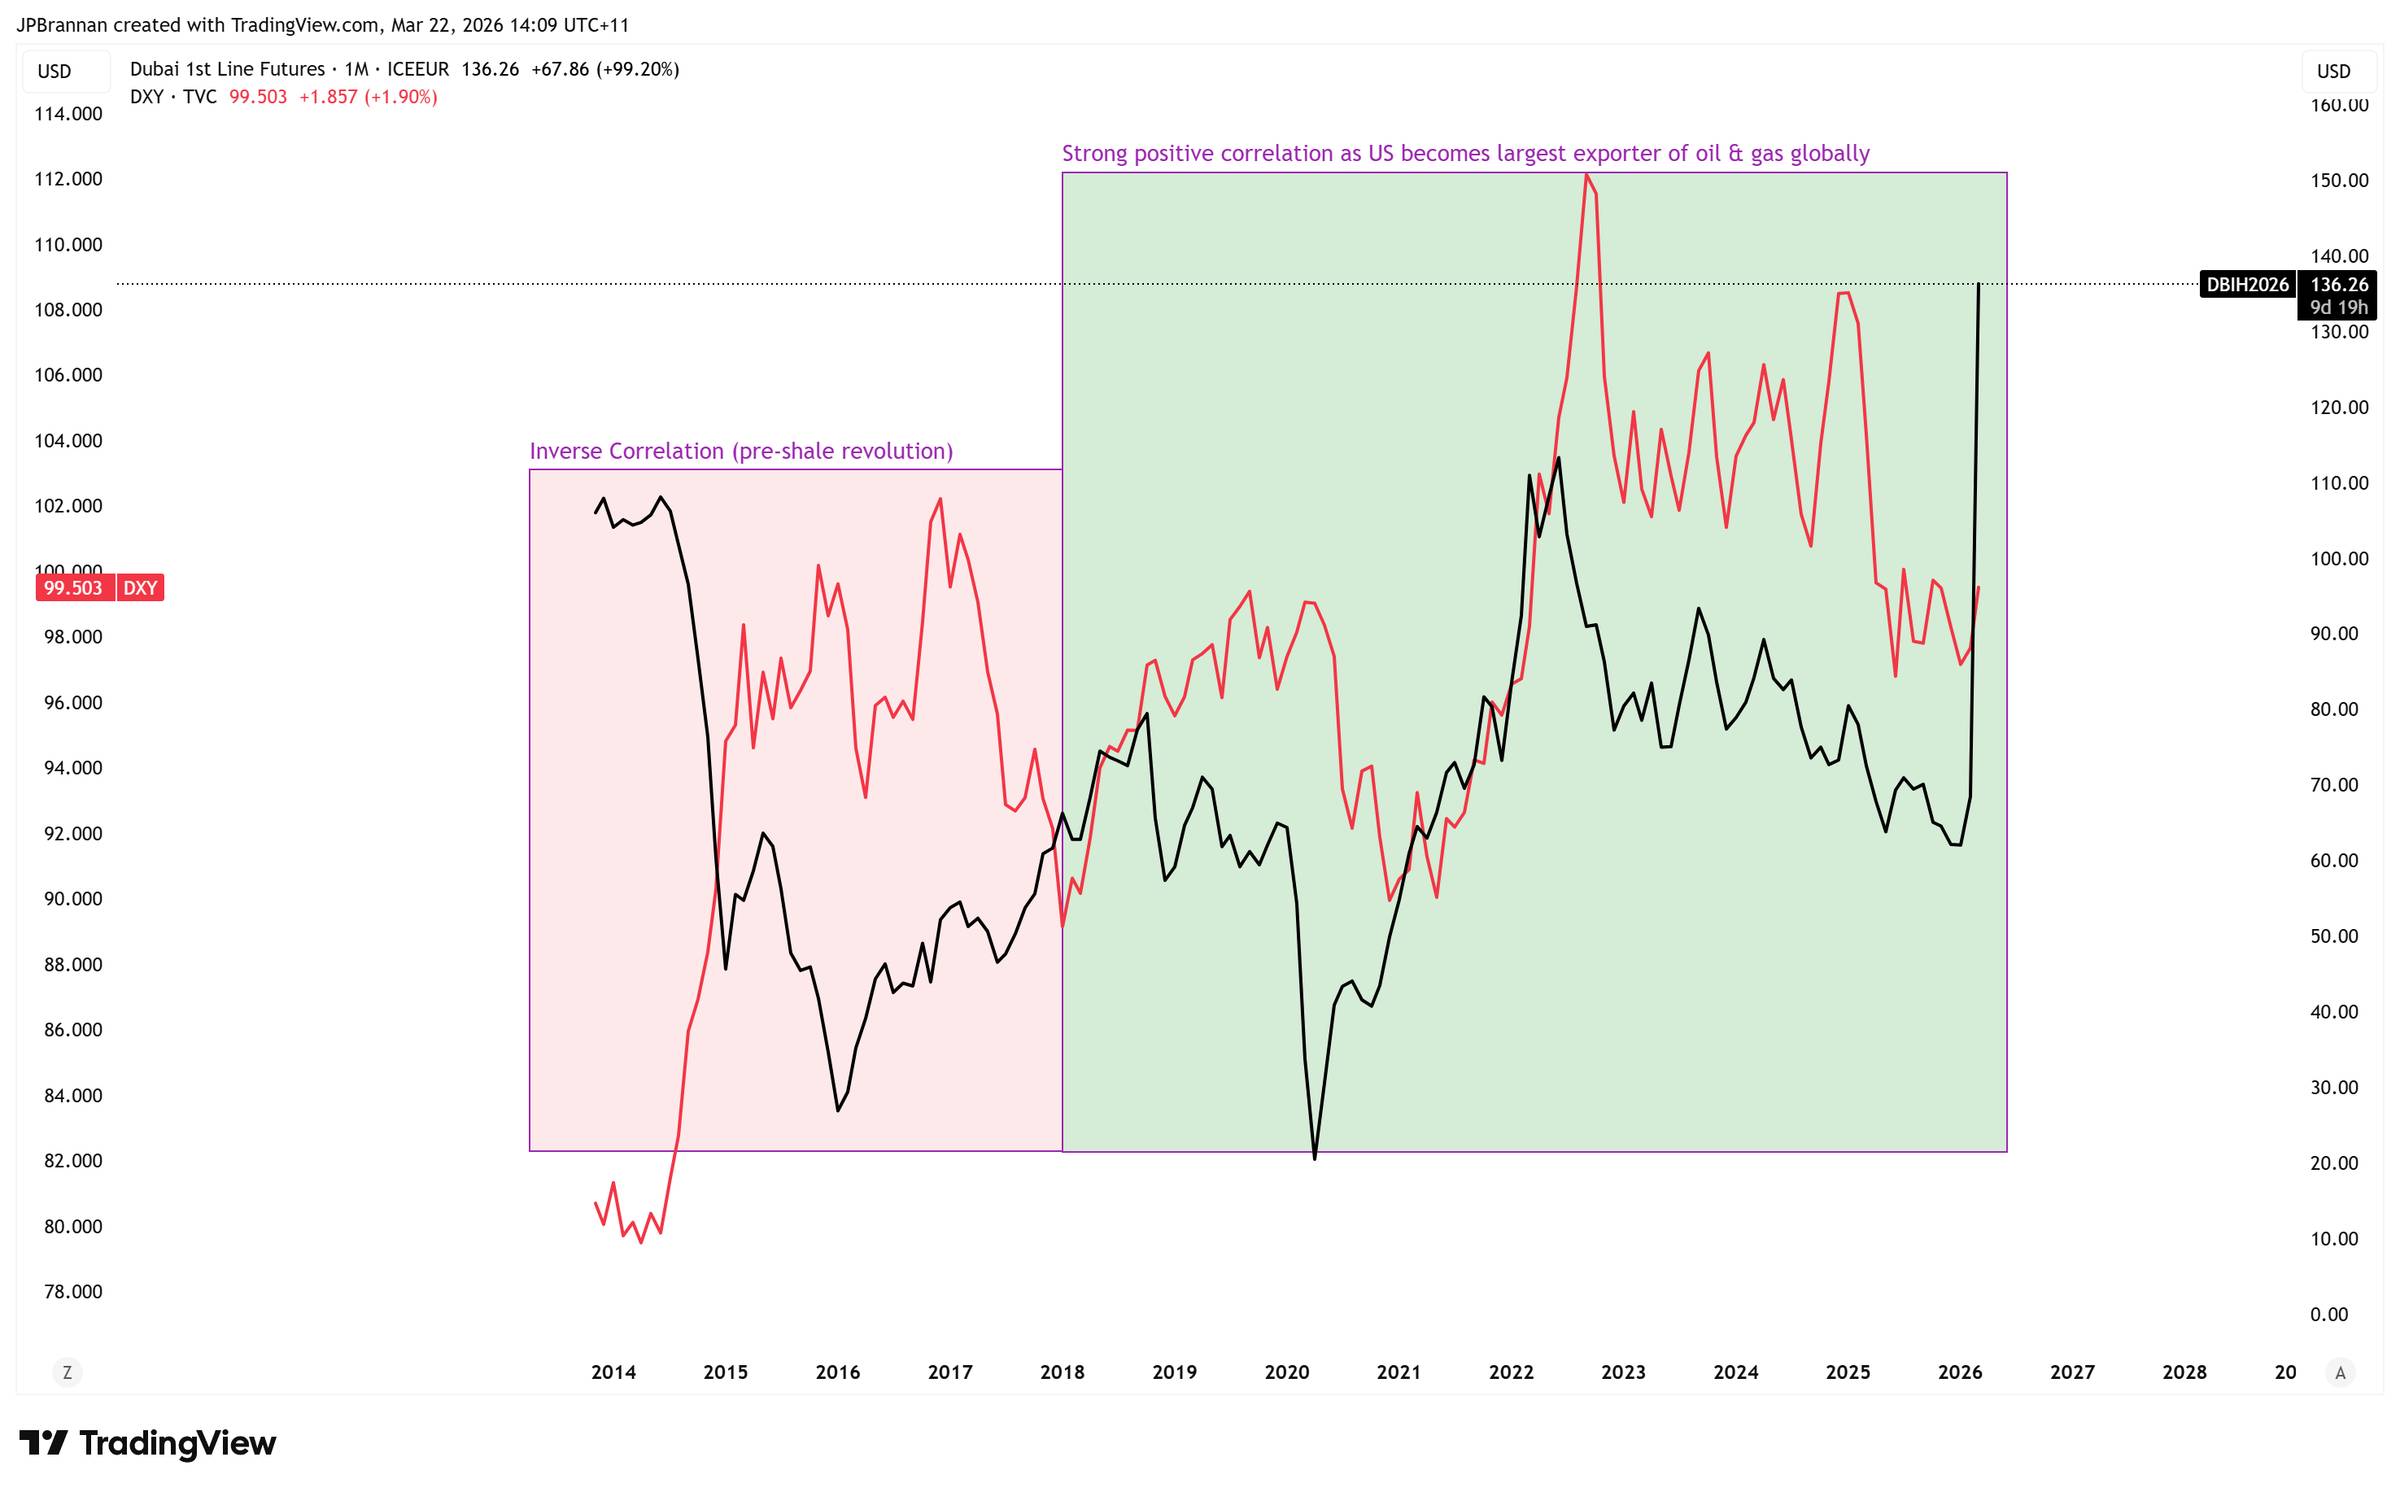
Outside of interest rates and oil prices, one economic indicator that we are currently watching closely is the Dollar Strength Index (DXY) as it often gives signs on the direction of markets in the coming months.
When oil prices rise, typically the dollar follows - exhibiting a strong correlation since 2018 (green area). Previously, the dollar was inversely correlated (red area) to oil prices as the US was a major importer of oil before the shale revolution began which turned the US from the world's largest net energy importer, to one of the world's largest energy exporters. In short, importing oil meant more dollars sent overseas (weaker dollar), exporting oil means more currencies buying oil in USD (stronger dollar).
The reason this matters is that as we mentioned earlier, financial assets can often trade inverse to the dollar's strength. See below bitcoin's price in orange and the dollar stength in black.
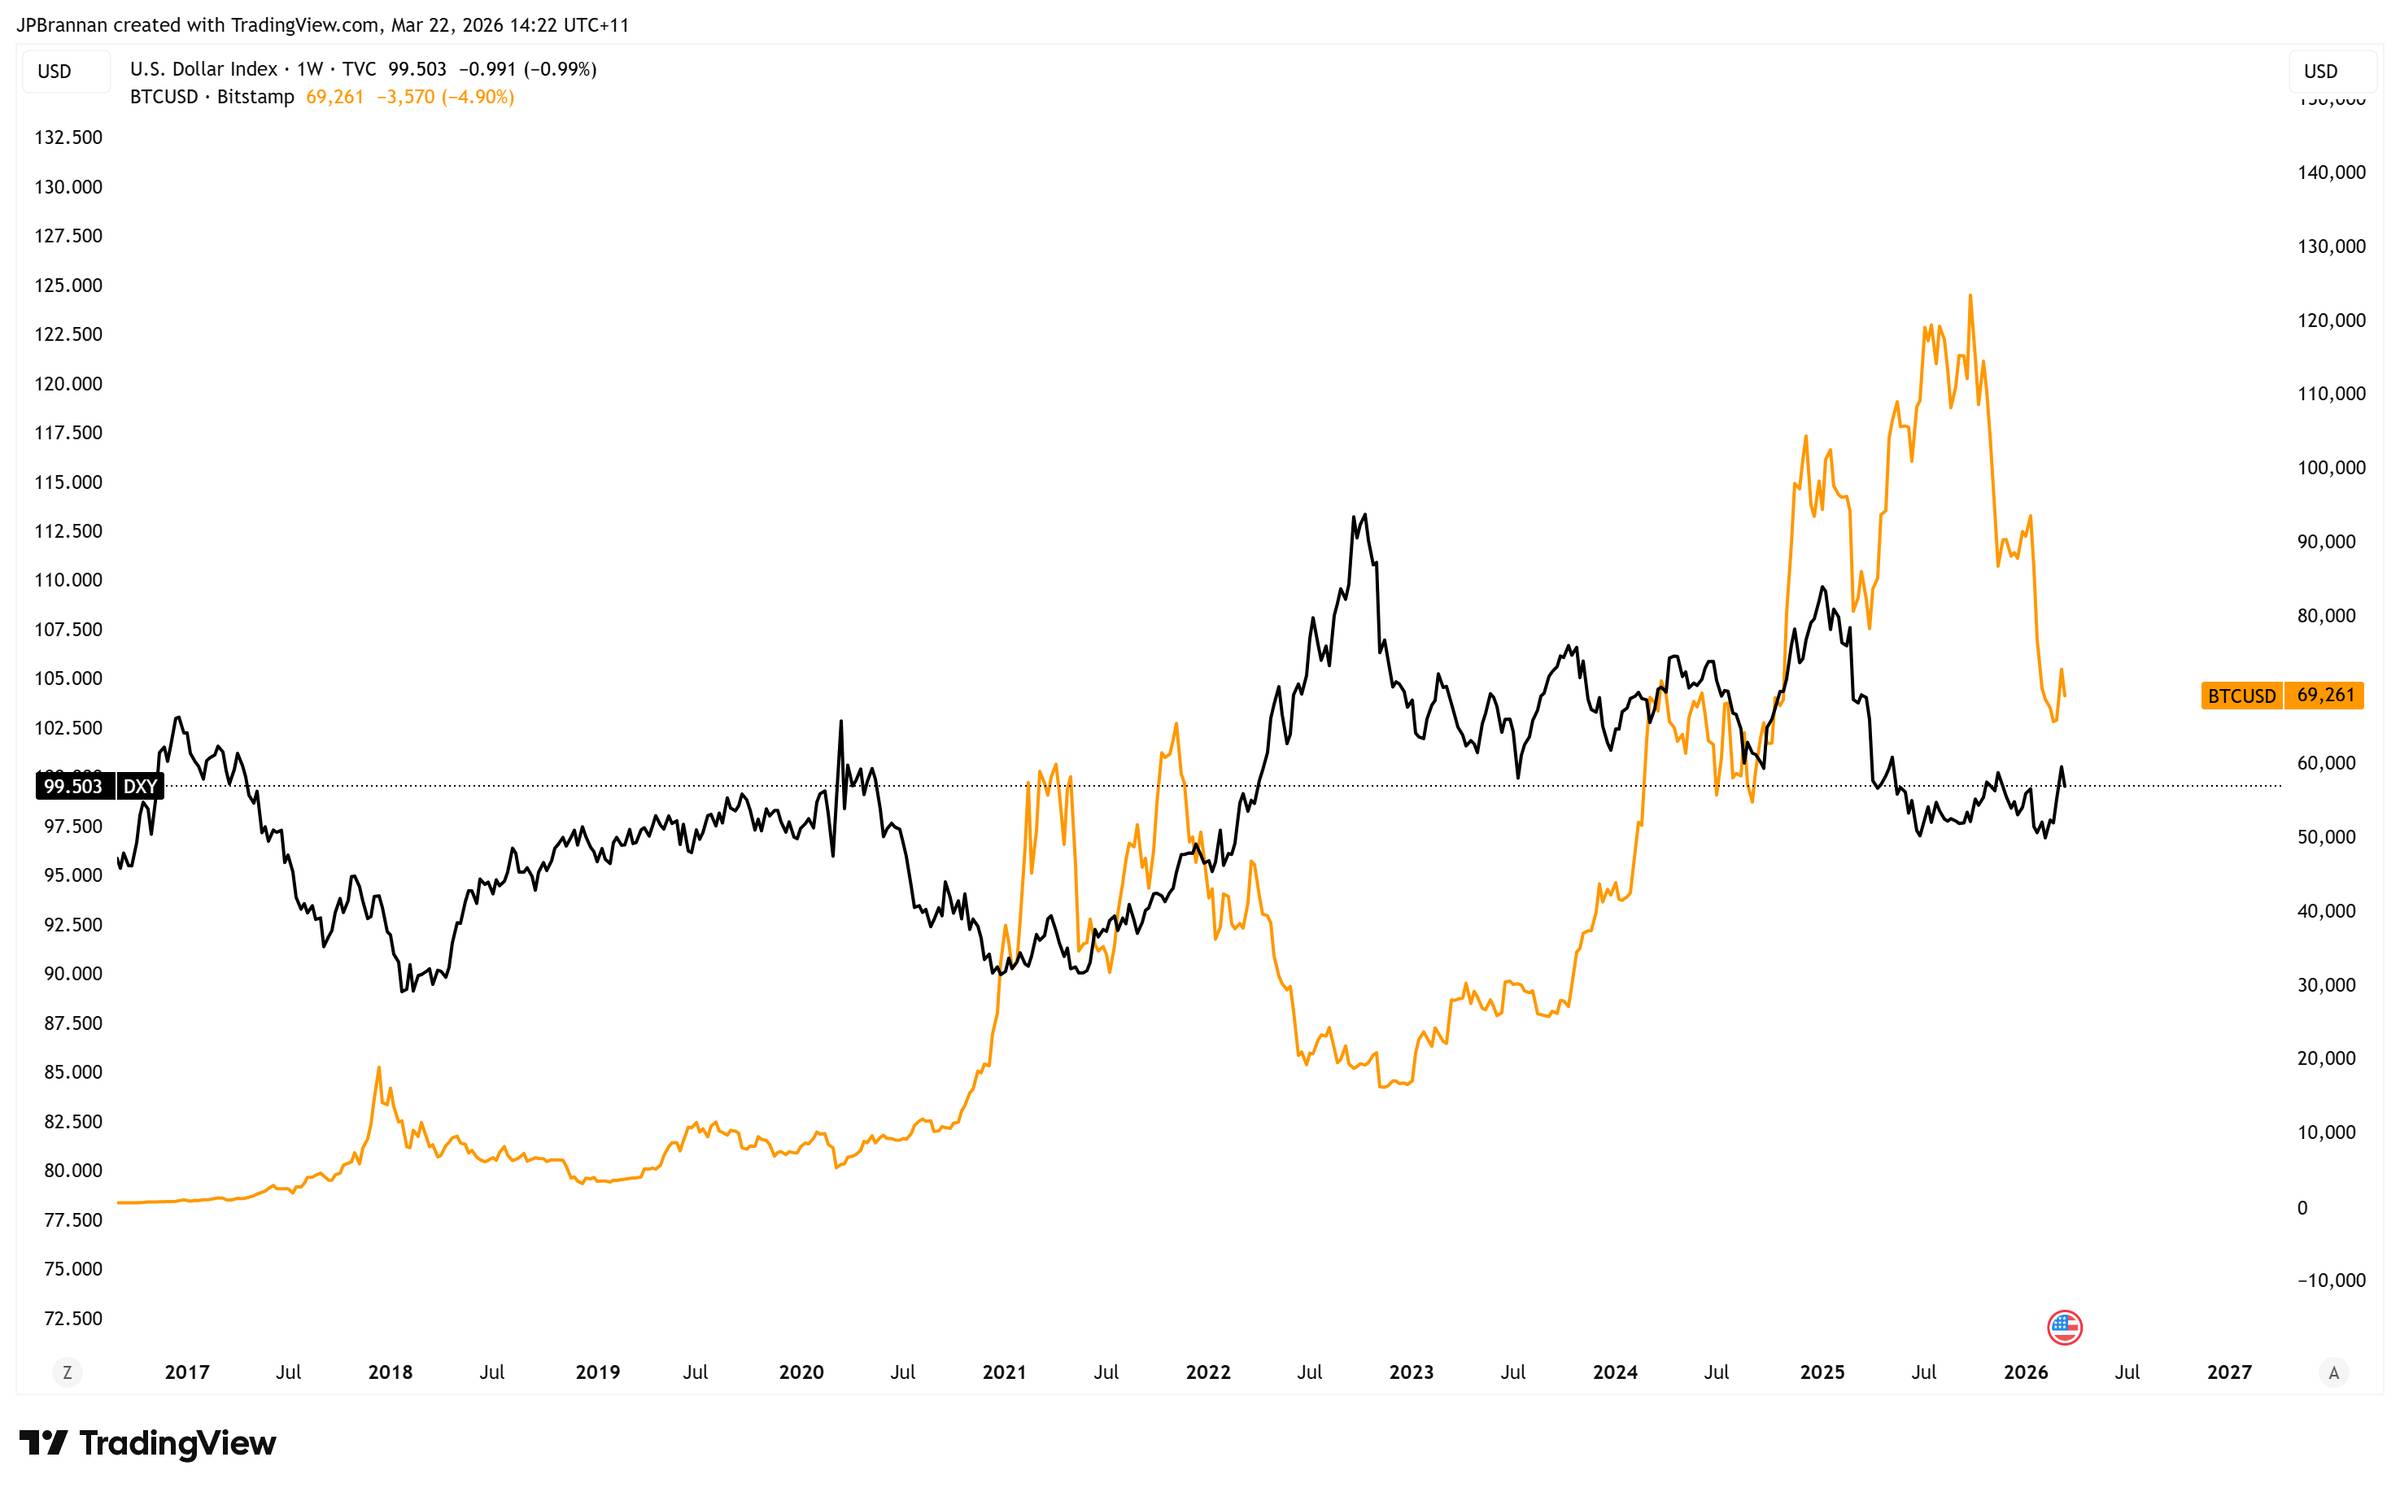
While for now, the DXY is still chopping sideways, the recent spike is something we are monitoring closely.
The key question remains how long does this conflict last and whether the US and other countries can bring oil and gas capacity back online within a timeline that won't trigger prolonged inflation and the potential of further interest rate rises as a consequence.
US Regulators Confirm 16 Cryptos Officially Not Securities
On 17 March, the SEC and CFTC issued a landmark joint interpretation classifying 16 crypto assets as "digital commodities" rather than securities. Bitcoin, Ethereum, Solana, XRP, Cardano and 11 others now fall under CFTC oversight, a significantly lighter regulatory framework.

Implications for investors
This is the single most consequential regulatory development for crypto since the Bitcoin ETF approvals in January 2024. For assets like XRP and Solana, which traded under an SEC enforcement cloud for years, the reclassification removes a major institutional barrier. However, the interpretation is not law, it is agency guidance that a future administration could revise.
The CLARITY Act, which passed the House 294-134 last year, remains stalled in the Senate over a stablecoin yield dispute between banks and crypto firms. Senator Lummis has flagged an April markup target, and Polymarket gives passage 72% odds. Until Congress acts, this is a strong signal but not a permanent settlement. Investors should treat the ruling as structurally bullish for altcoins, however, keeping in mind that broader macro conditions are dominating the market currently.
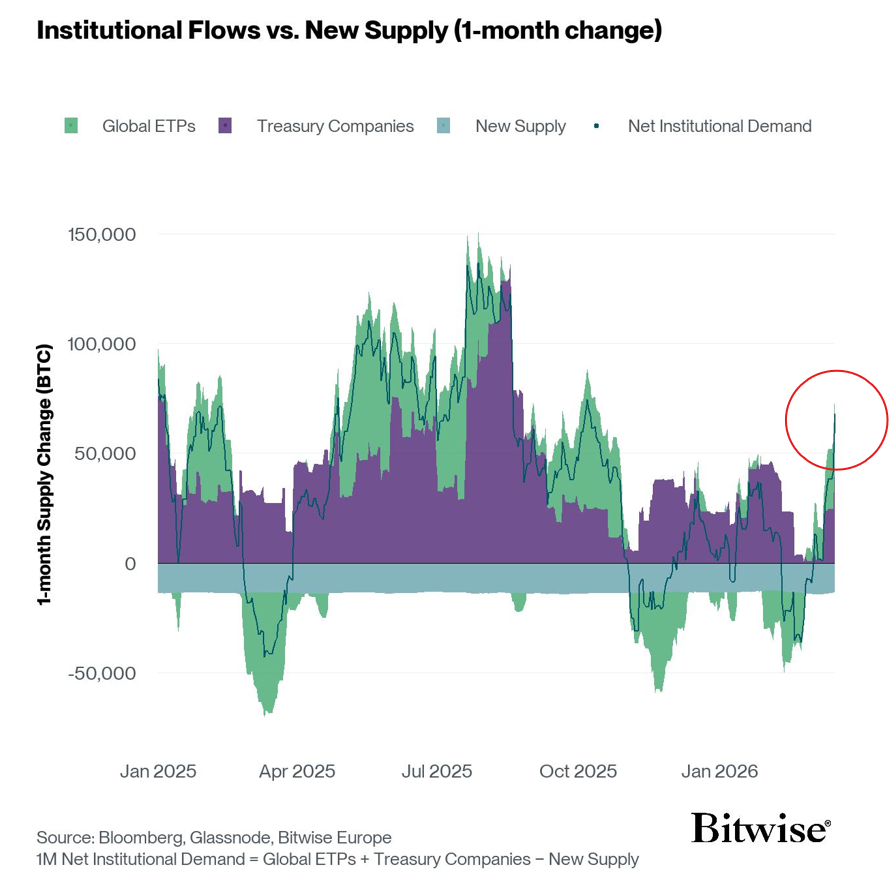
Strategy Buys US $1.57 Billion in Bitcoin - Flows vs. Supply
Last week, Strategy (formerly MicroStrategy) executed its largest single-week Bitcoin acquisition of 2026, purchasing 22,337 BTC at an average price of US $70,194 per coin. The US $1.57 billion purchase was primarily funded through US $1.2 billion in sales of its STRC perpetual preferred shares, with the remaining US $400 million raised via common equity.
Along with Bitcoin ETFs and other treasury companies, institutional buying is 400% the rate of newly mined bitcoin - a bullish catalyst for long-term price potential.
Strategy's total holdings now sit at 761,068 BTC, acquired for approximately US $57.6 billion at an average cost of US $75,696 per coin, representing roughly 3.5% of Bitcoin's 21 million supply cap.
Implications for investors
Strategy is acquiring Bitcoin at a pace that, if sustained, would see it reach one million BTC by year-end, requiring roughly 5,700 BTC per week for the remainder of 2026. With the halving having cut miner issuance to roughly 450 BTC per day (3,150 per week), Strategy alone is absorbing nearly twice what miners produce.
The contrarian concern is problematic however. Strategy's preferred share, STRC gives investors an 11.5% annual dividend. The company carries approximately US $887 million in fixed debt obligations, so if Bitcoin stagnates and their ability to raise more external capital tightens, their flywheel could lose steam.
We still view Strategy as being incredibly well capitalised despite the above mentioned risk factor. Their bitcoin holdings exceed US $52 billion, with a further $2.25B in cash and total debt obligations are ~US $8.2 billion.
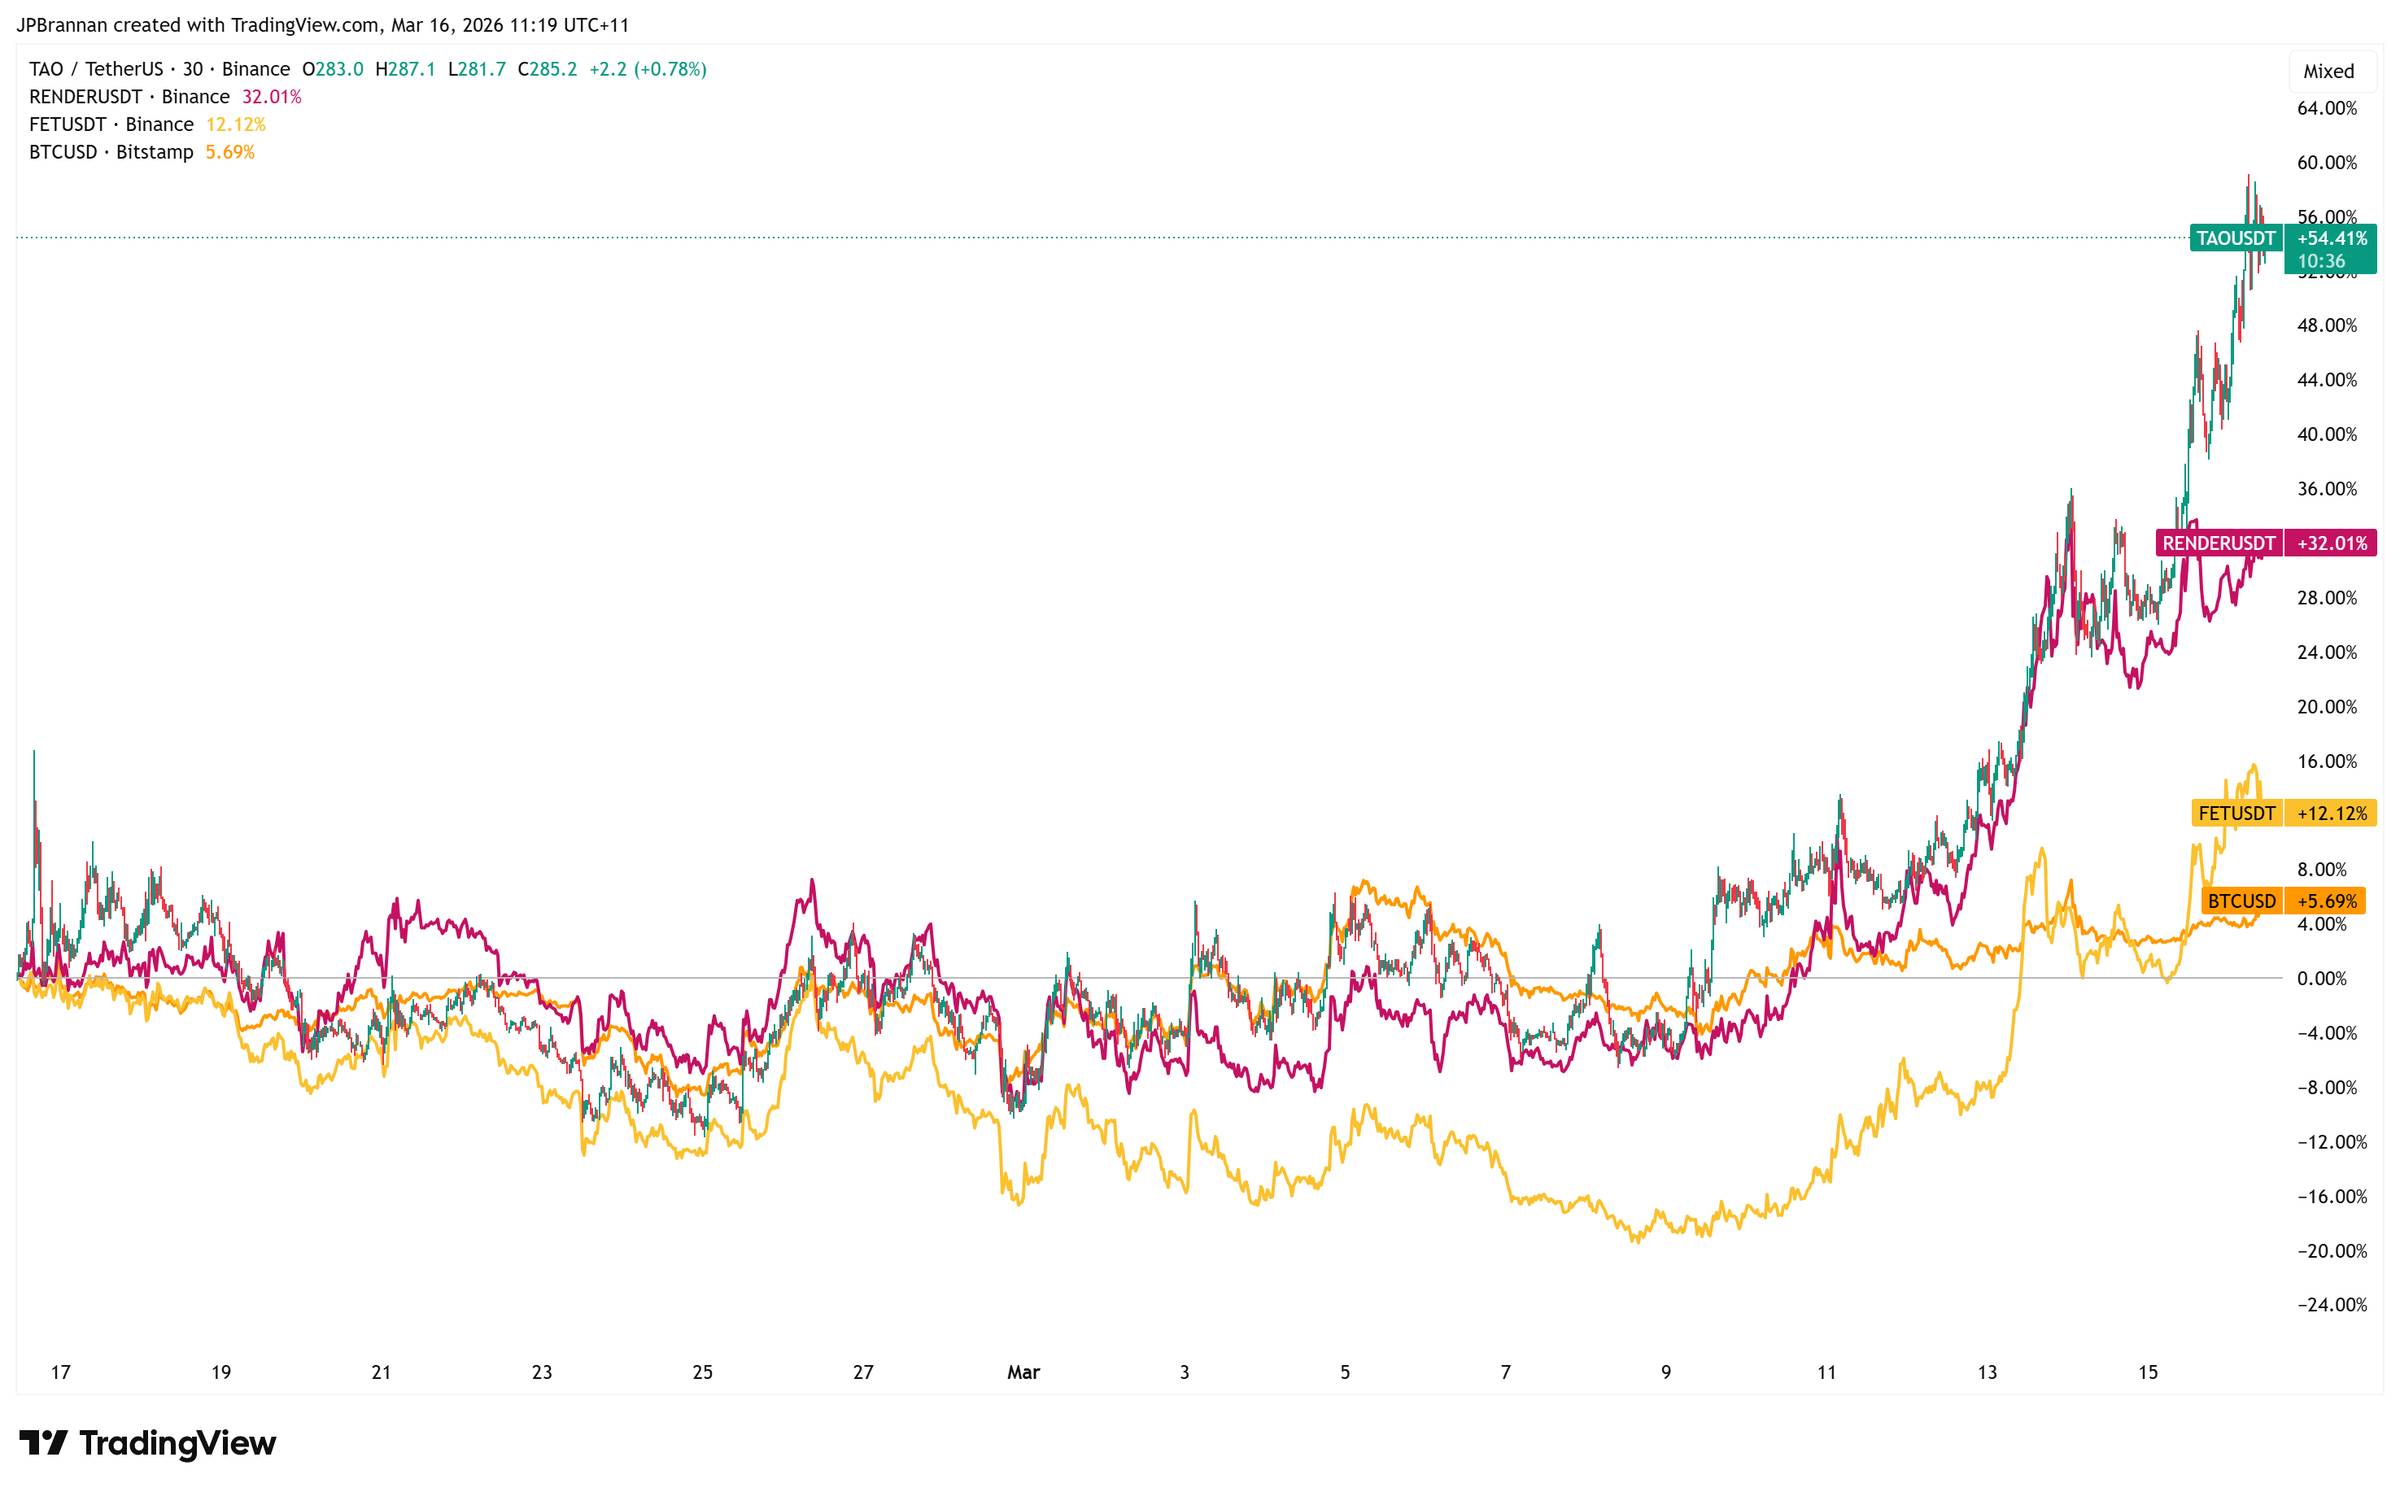
AI Tokens Surge 55% - Here's Why
AI tokens posted their strongest week in months, with Bittensor (TAO) - a blockchain-based marketplace where developers train and exchange AI models - surging 55%, while Render (RNDR) and Artificial Superintelligence Alliance (FET) gained 32% and 12% respectively.
Nvidia CEO Jensen Huang and venture capitalist Chamath Palihapitiya recently commented on how the BitTensor network which uses the TAO token as its incentive mechanism had been able to train a 72 billion parameter LLM model in a decentralised manner.

Implications for Investors
Bittensor and Render could become genuine alternatives to AWS and Google Cloud for AI developers who simply cannot access the GPU power they need at an affordable cost base.
New data-centre builds now take 12 to 24 months from design to deployment while decentralised GPU marketplaces are offering compute at 50% to 80% below hyperscale cloud pricing - an H100 GPU runs US $2 to US $3 per hour on platforms like Lambda and RunPod versus US $6+ per hour on AWS (Source: RunPod, Thunder Compute, GMI Cloud).
Comparing GPU Compute Pricing Across Hyperscalers vs. Decentralised Providers
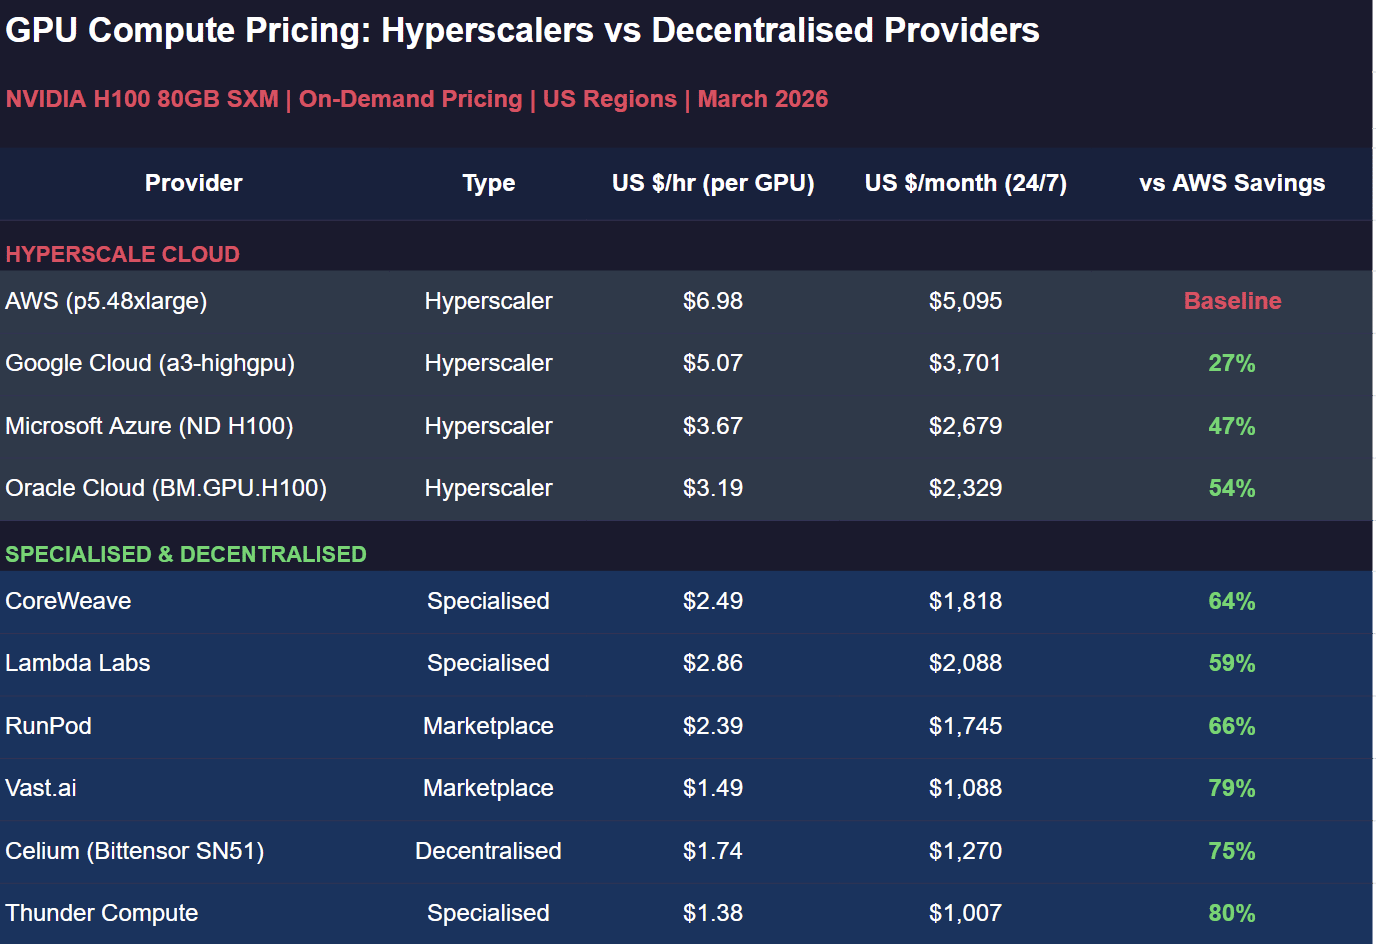
With Alphabet, Amazon, Microsoft, and Meta planning to invest over US $400 billion in data centres in 2026 Bittensor and Render are positioning themselves as genuine overflow infrastructure for AI developers who cannot access the GPU power they need at an affordable cost base.
Whilst still early stages, we think there are some interesting economic use cases at the intersection of blockchain tokens like TAO and AI that may warrant consideration for suitable investor portfolios.
Until next week,
James