.png)
Thanks for reading The BlockByte Weekly, where we summarise the key updates in crypto over the last week and provide our perspective on what you need to know as an investor.
Weekly Snapshot
- BTC: US $97,970 (+0.6%)
- ETH: US $2,089 (-0.5%)
- Crypto Market Cap: US $2.38T (+0.9%)
- Gold: US $5,042/oz (+0.0%)
- S&P 500: 6,836 (-1.2%)
- ASX 200: 8,919 (+1.9%)
Executive Summary
- Crypto markets dropped paradoxically at the beginning of the week due to stronger than expected jobs and unemployment data before staging a Friday rebound as US CPI surprised to the downside at 2.4%
- The long-term outlook for spiralling US debt remains our core thesis for holding hard assets as fiscal deficits (when a government spends more than it brings in through taxes) is expected to grow from US $1.9T per year to US $3.1T by 2036
- Goldman Sachs, Strategy, and Binance collectively deployed or disclosed billions in digital asset exposure over the past fortnight, signalling that institutional conviction is deepening even as prices remain under pressure
- Solana continues to lead all major blockchains in active users, transaction volume, and developer growth, yet its token trades 71% below its all-time high, highlighting a rare divergence between fundamentals and price
US Economy Shows Resilience While Long-term Deficits Remain Key Issue
Over the last week, price action across the digital asset sector was choppy once again. Starting the week, stronger than expected US payroll data showed 130,000 jobs added versus 70,000 expected, and a decline in unemployment for January to 4.3%. The net effect was the market reduced its expectations of a rate cut at the Fed's next meeting in mid-March. The top 5 crypto assets by market cap (BTC, ETH, XRP, BNB, SOL) fell between -5% and -13% by the middle of the week on the fade in chances of a rate cut.
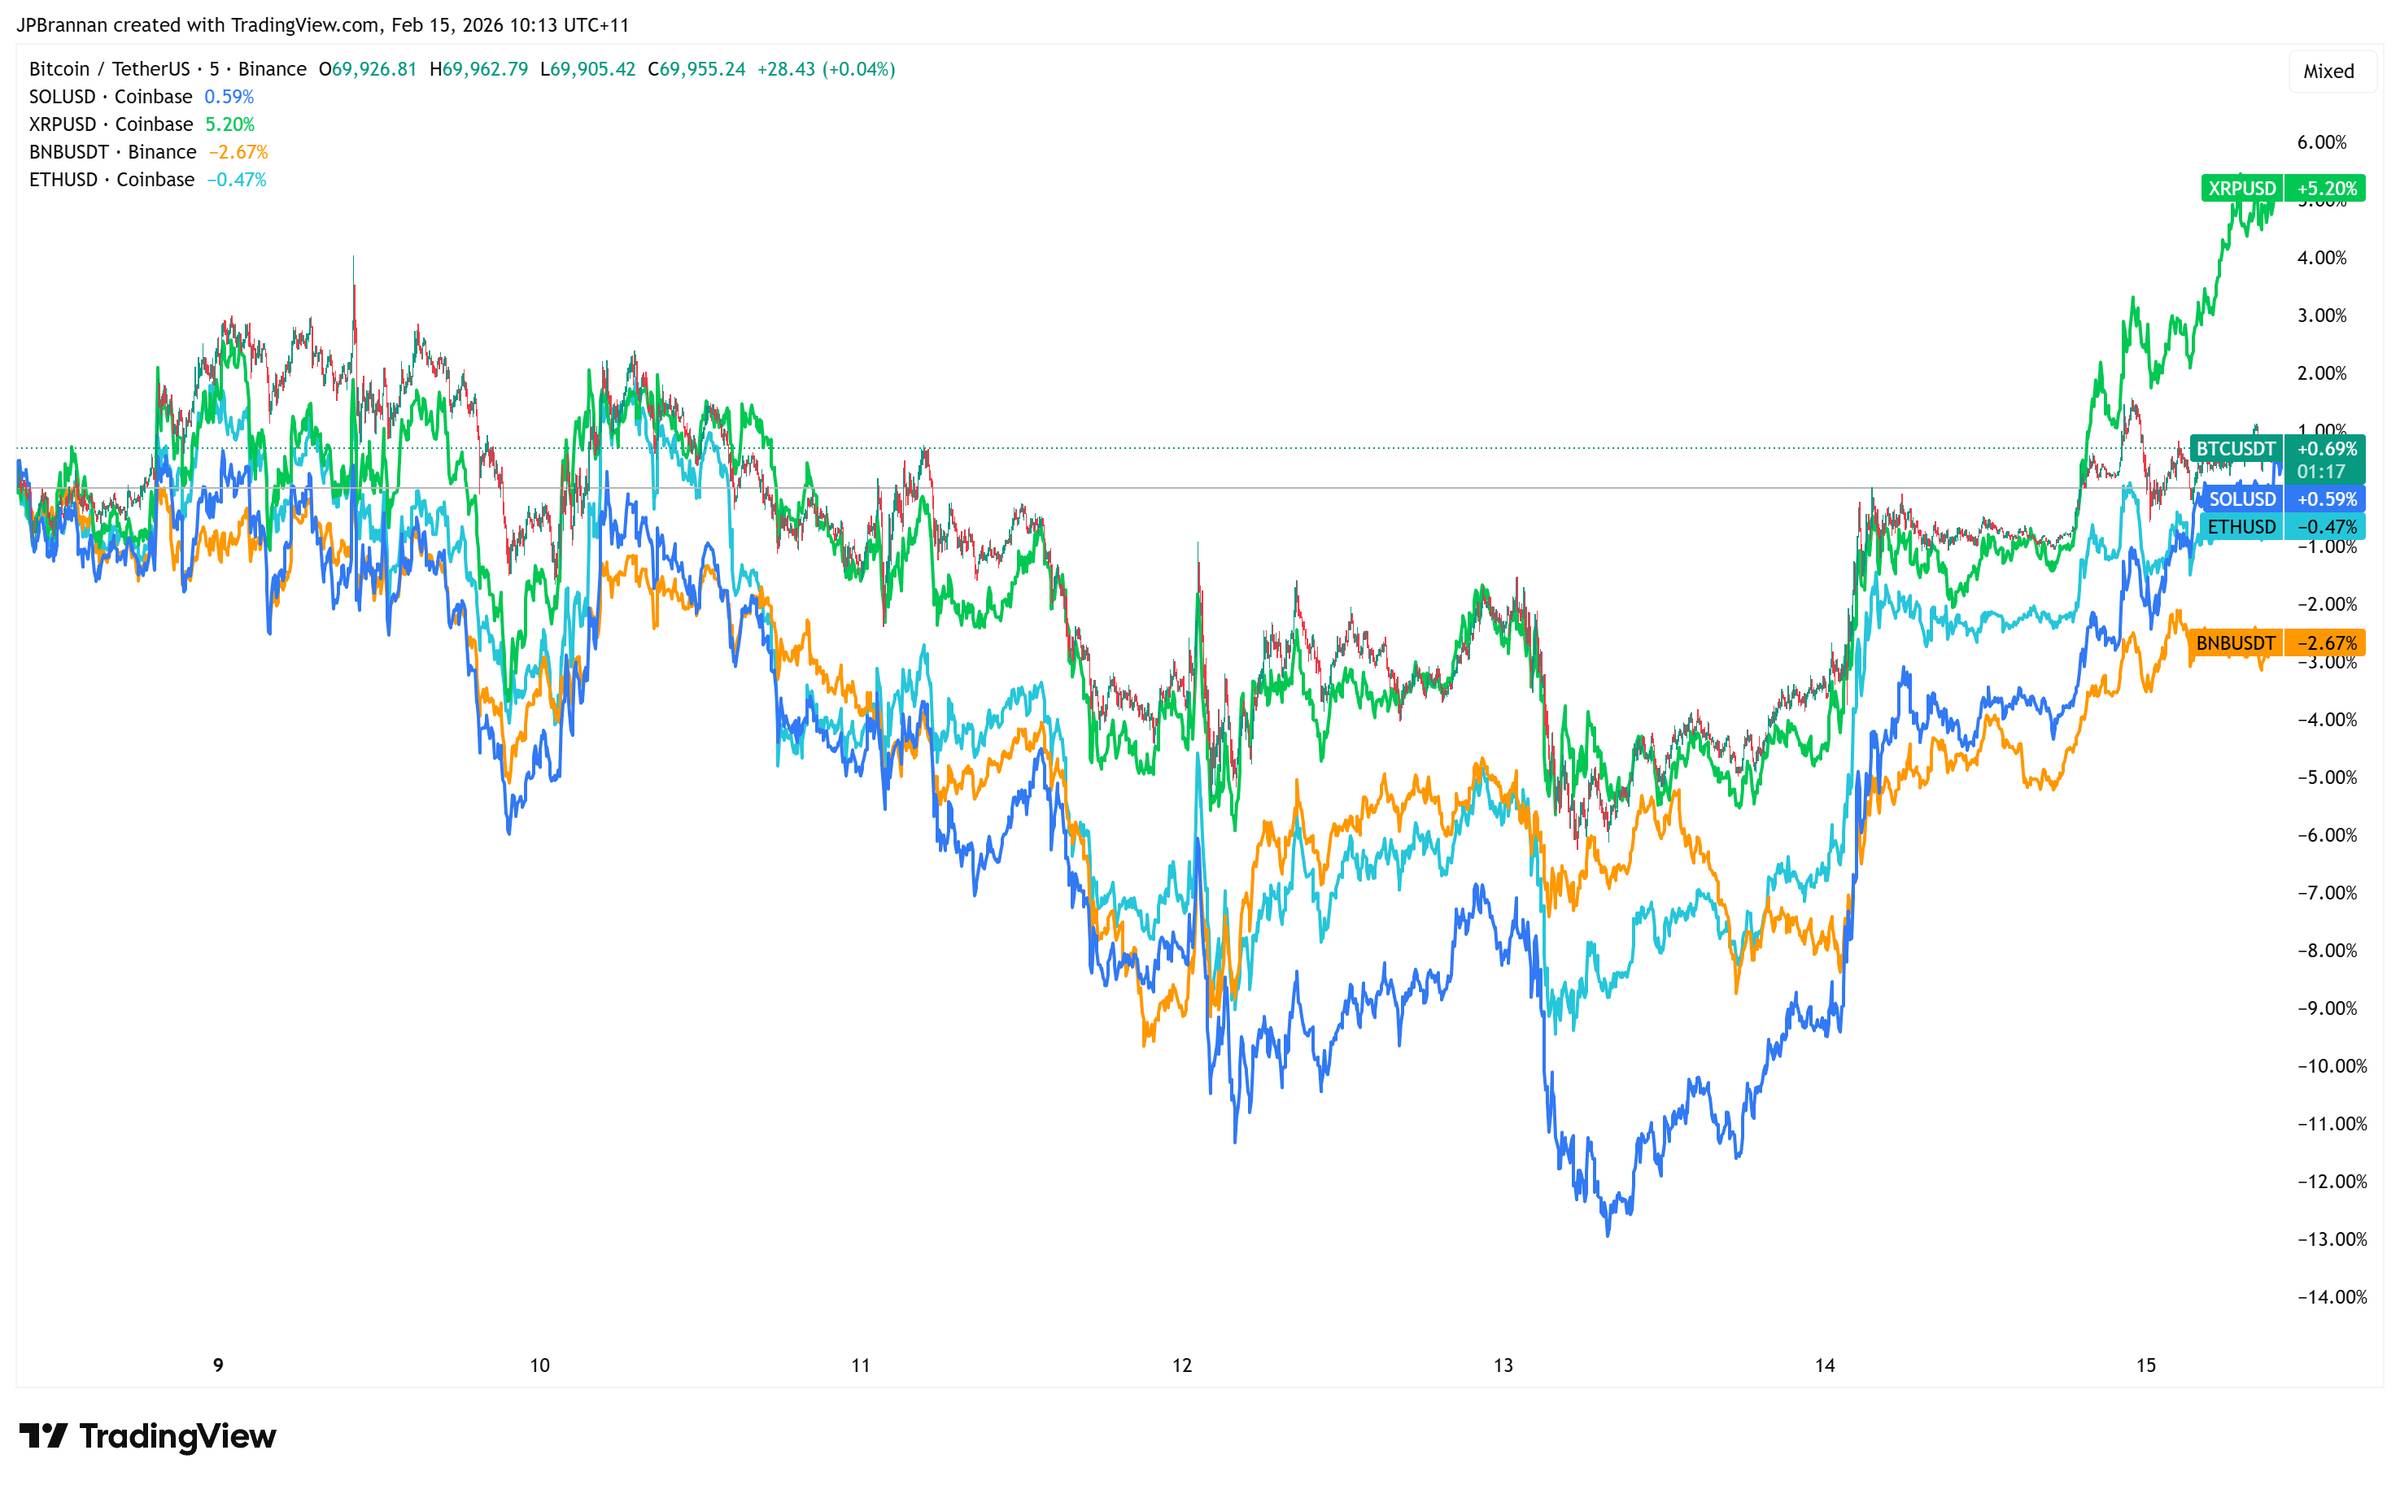
However, the mood shifted decisively on Friday as the release of January's CPI came in at 2.4% year-on-year, below the 2.5% consensus and a notable improvement from December's 2.7%. The softer print reignited hopes of multiple rate cuts later in 2026. By comparison, here in Australia our current CPI is 3.8%, well above the 2% target range.
Bitcoin surged roughly 5% on Friday's CPI release, pushing back above US $70,000. However, much of Friday's rally appears to have been driven by a short squeeze as funding rates had been deeply negative heading into Friday. Negative funding means more derivative traders were paying a premium to go short rather than long. Spot Bitcoin ETFs also saw a modest US $15 million inflow on Friday, but outflows still topped US $504 million for the week, 31% less than the US $735 million outflows in the prior week.
The Bigger Debt Picture
Taking a step back, we recommend skipping to 32min 48s in the video below (you can find the timestamp in the video description). In the lastest All-In podcast episode, they discuss the 'US Debt Death Spiral'. Sounds very ominous, and long-term it is.

Here's the actual quote from the CBO report recently released:
'In CBO's projections, the federal budget deficit in fiscal year 2026 is $1.9 trillion and grows to $3.1 trillion by 2036. Relative to the size of the economy, the deficit is 5.8 percent of gross domestic product (GDP) in 2026 and grows to 6.7 percent in 2036, which is greater than the 3.8 percent deficits averaged over the past 50 years.
US Public Debt to GDP Actuals & Forecast, 1900 to 2056
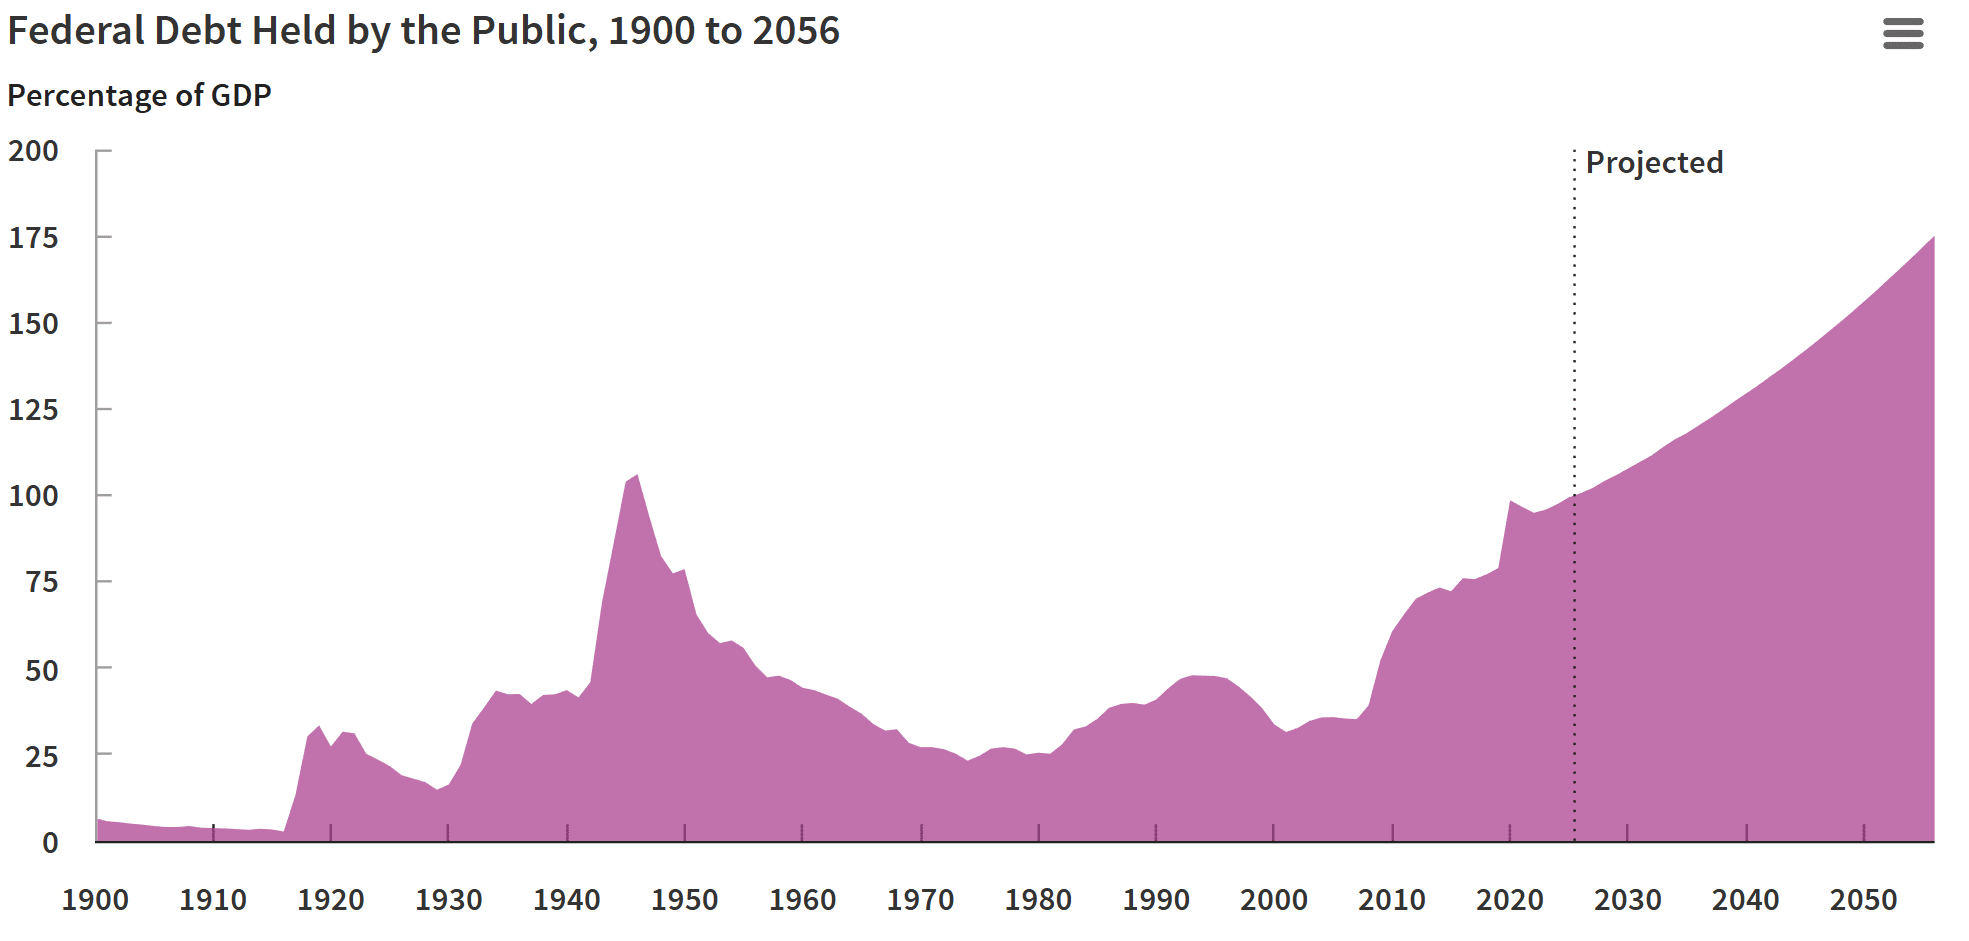
The key takeaway here is that despite any efforts by the current administration to reduce deficits through tariffs and elimination of waste in the government, the combination of surging interest rate costs on the debt combined with slower immigration and an ageing population shows that the US is on an accelerating path to currency debasement.
For investors, it's important to remember that these trends can take years if not decades to play out, but our core thesis remains stronger than ever. Scarce, transportable and globally recognisable assets that cannot be seized through taxation or confiscation will become increasingly sought after in the years to come. We see the current pullback in bitcoin and select digital assets as a rare buying opportunity.
Institutions Buy Over US $2.7B in Crypto Exposure Over the Last Fortnight
Despite the turbulence over the past two weeks, we have seen a wave of institutional deployment into digital assets. Goldman Sachs disclosed more than US $2.36 billion in crypto exposure in its Q4 2025 13F filing with the SEC. The holdings include approximately US $1.1 billion in Bitcoin, US $1.0 billion in Ethereum, US $153 million in XRP, and US $108 million in Solana. At 0.33% of Goldman's overall portfolio, the allocation is small in relative terms, but it places the bank among the most crypto-exposed major US financial institutions.
Strategy (formerly MicroStrategy) added 1,142 Bitcoin for approximately US $90 million at an average price of US $78,815. The purchases, funded through equity sales, were executed between 2-8 February, likely before the mid-week crash that briefly took Bitcoin below US $60,000. Strategy's total holdings now stand at 714,644 BTC with an average lifetime cost basis of US $76,056. With Bitcoin trading around US $69,000 at week's end, the company's US $54.35 billion position is sitting on an unrealised loss of roughly US $4.8 billion, the first time in nearly two years that the treasury has been meaningfully underwater.
Binance completed the conversion of its Secure Asset Fund for Users (SAFU) entirely into Bitcoin, purchasing a final tranche of 4,545 BTC for approximately US $305 million at an average price of US $67,000. This brought total SAFU holdings to 15,000 BTC valued at approximately US $1.005 billion, completing a 30-day accumulation programme first announced on 30 January. The fund, originally backed by stablecoins as an emergency reserve for users, is now fully denominated in Bitcoin. Binance has committed to replenishing the fund with its own capital if the value drops below US $800 million, effectively creating a structural buy mechanism during periods of price weakness.
Why should investors care?
The common thread across all three stories is that large institutions and platforms are building or maintaining crypto positions during a period of extreme fear. The Crypto Fear & Greed Index hit a low of 5 earlier this month, one of the lowest readings on record. Historically, institutional buying during retail capitulation has preceded significant recoveries, though that is certainly not guaranteed.
Will Solana's Performance Lead a Price Turnaround?
Solana continues to rank first across key on-chain metrics, including active users, transaction volume, developer growth, and network fees. In early January, Nansen data showed the network recorded 18.28 million active users (up 23% week-on-week), 453.5 million transactions (up 17%), and US $52.4 billion in DEX volume (up 20%).
Solana leads the top 5 across transactions, monthly active users, economic activity and chain revenue:
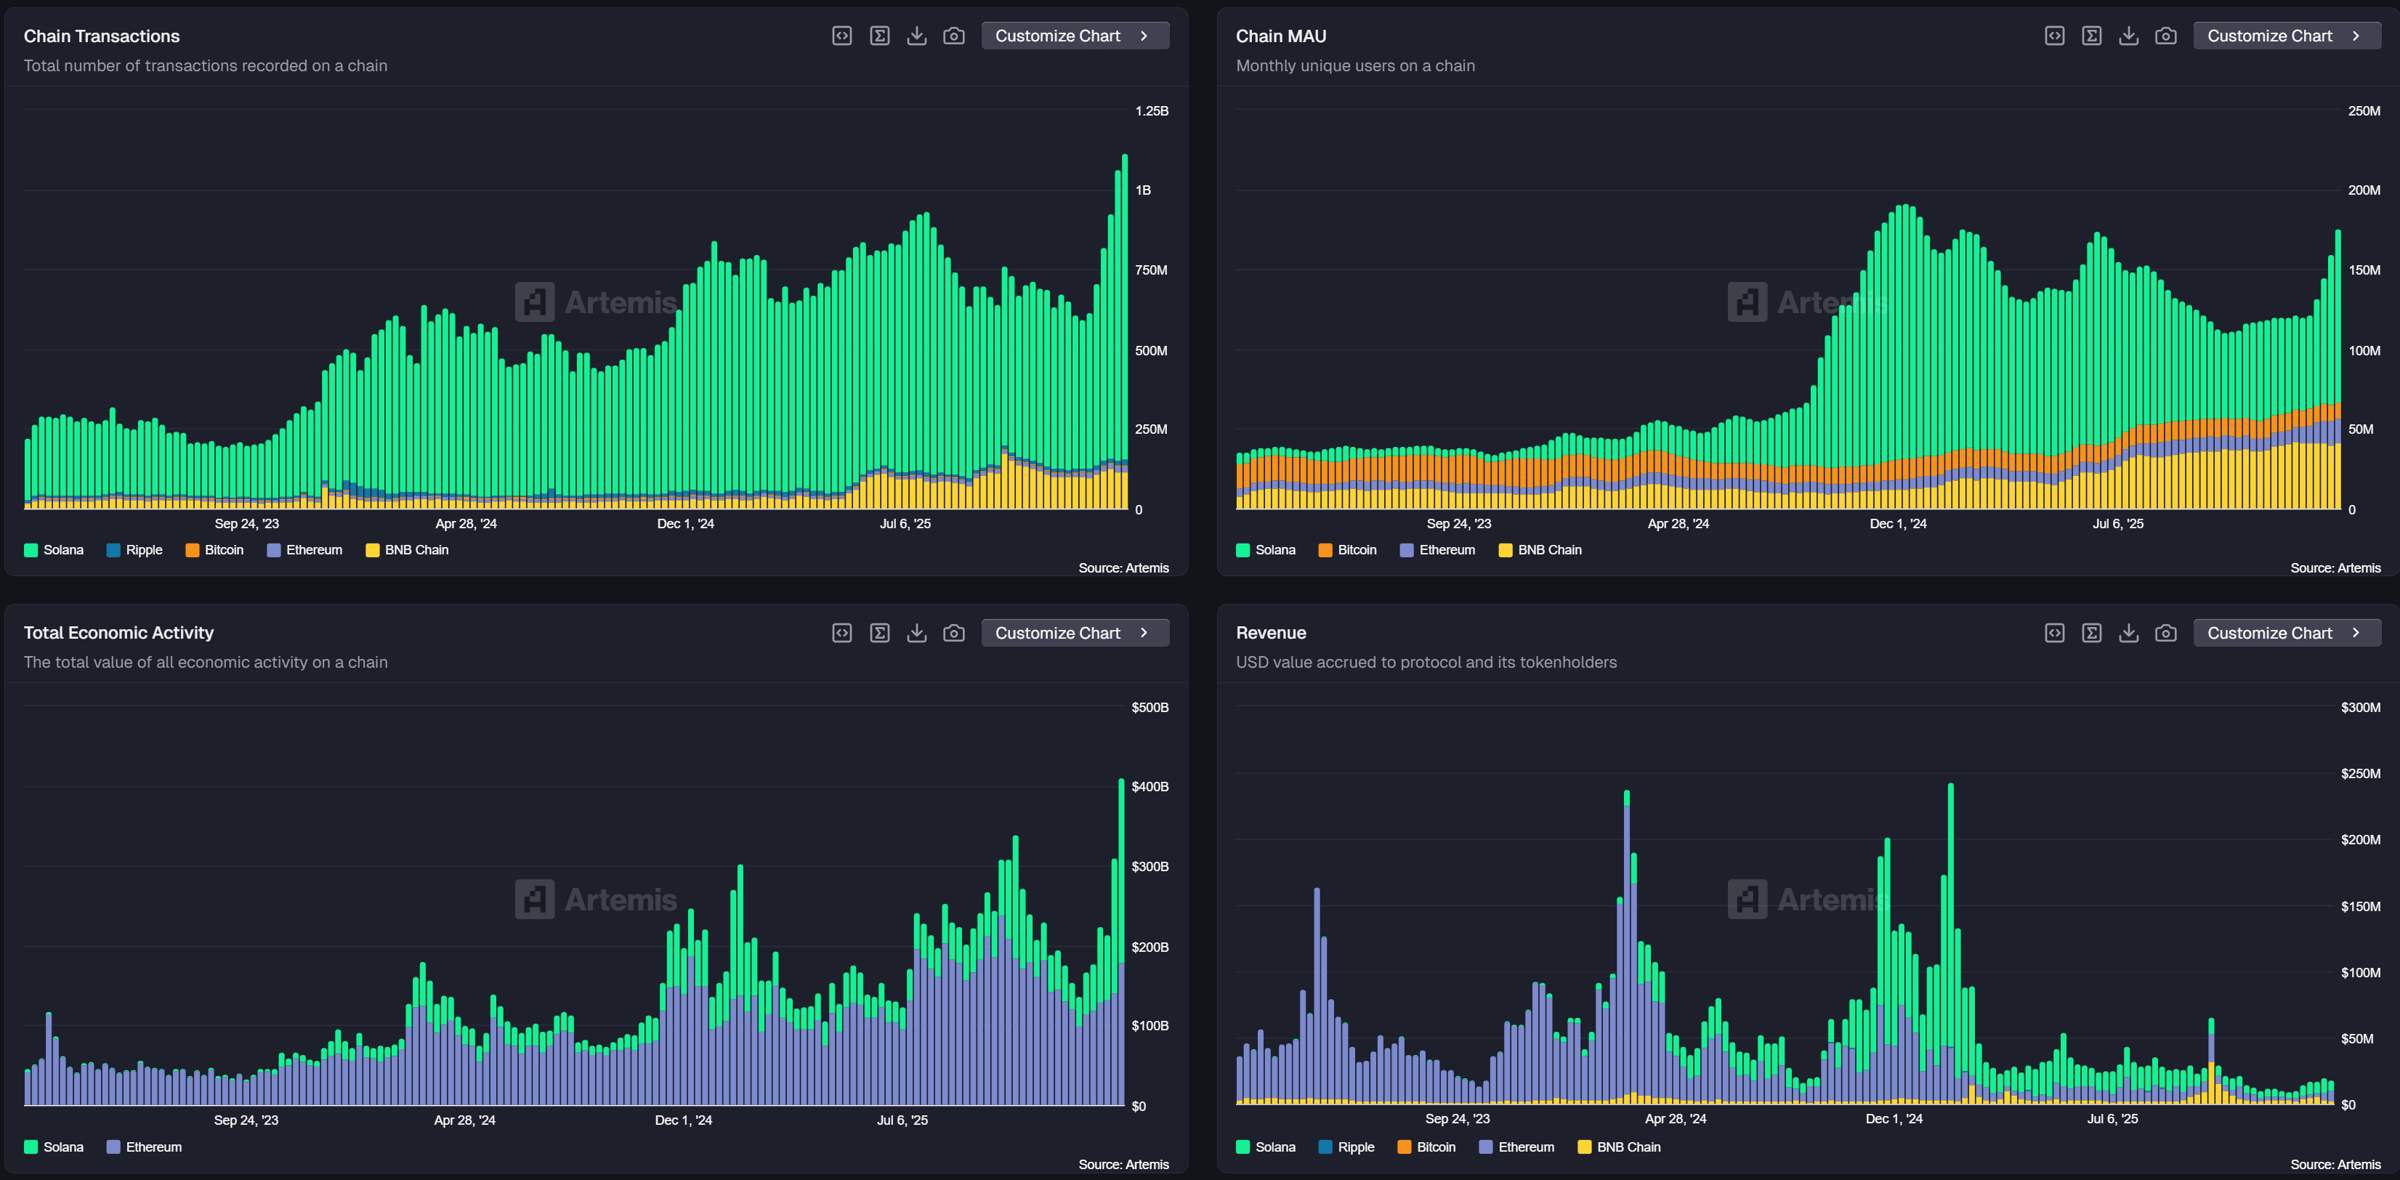
The developer ecosystem has expanded to approximately 17,700 active developers, with Solana onboarding 11,534 new developers in the first nine months of 2025, representing 83% year-on-year growth and outpacing Ethereum's 5.8% growth rate over the same period. Crucially, the network has now maintained over 24 consecutive months of unbroken uptime, a significant shift from earlier reliability concerns that plagued the chain through 2022 and 2023.
The institutional narrative around Solana is also evolving. Goldman Sachs' 13F filing revealed US $108 million in Solana ETF exposure, its first-ever position in SOL. Morgan Stanley has filed SEC applications for spot Solana ETFs. Bitwise's Solana Staking ETF, the first staked crypto ETF in the US, has seen consistent inflows, while Forward Industries has built a public Solana treasury holding over 6.9 million SOL. WisdomTree described Solana's network dominance as "structural, not cyclical."
Major protocol upgrades are also in the pipeline: Firedancer, the independent validator client developed by Jump Crypto, is expected to increase throughput to millions of transactions per second, while the Alpenglow consensus overhaul targets sub-100 millisecond finality.
Why should investors care? The striking feature of Solana's current position is the divergence between its on-chain fundamentals and its token price. SOL trades at approximately US $85, down roughly 71% from its all-time high and around 40% year-to-date. If usage, developer activity, and revenue are all growing, why is the token falling? The answer is macro, not micro. Solana, like most digital assets, is trading as a risk-on proxy alongside US tech stocks and broader crypto. The on-chain data suggests the network itself is not in distress; the price is reflecting macro risk appetite, not poor fundamentals.
However, there is a fair counter-argument. Much of Solana's transaction volume in recent quarters has been driven by memecoin trading and speculative cycles rather than durable utility. For investors with a longer time horizon, the question is whether the institutional pipeline (ETFs, corporate treasuries, enterprise applications) can fill the gap left by retail speculation. Early signals are encouraging, but the transition is far from complete.
Until next week,
James