.png)
Weekly Snapshot
- BTC: US $69,620 (-11.2%)
- ETH: US $2,081 (-13.2%)
- Crypto Market Cap: US $2.35T (-10.2%)
- Gold: US $4,967/oz (-6.0%)
- S&P 500: 6,932 (+0.3%)
- ASX 200: 8,708 (-0.1%)
Executive Summary
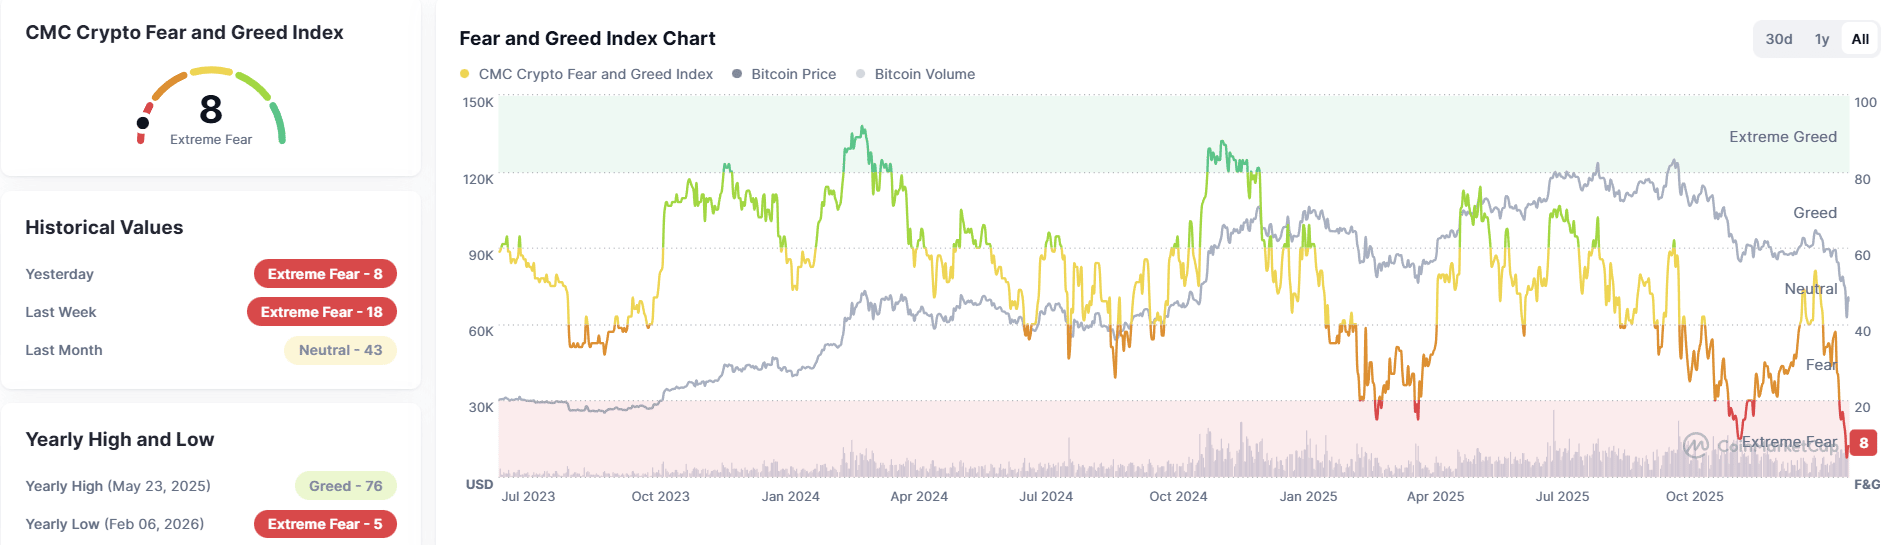
- Bitcoin fell $15,000 in 24 hours - its largest single-day dollar decline ever - briefly hitting $60,000 before rebounding to $69,000 (down 45% from October's $126,000 peak).
- Fear & Greed index hit 8 (lowest since FTX/COVID crashes) as ETH, SOL, XRP, and BNB dropped 22%–32%.
- The catalyst for the crash appears to be driven by Trump's hawkish Fed Chair pick Kevin Warsh leading to selling and a potential hedge fund margin call which drove BlackRock's Bitcoin ETF to record $10.7B in daily volume.
- Despite compression on valuations for treasury companies Strategy and BitMine, we don't foresee any near-term liquidation risk as both balance sheets are well-capitalised with no forceable debt calls.
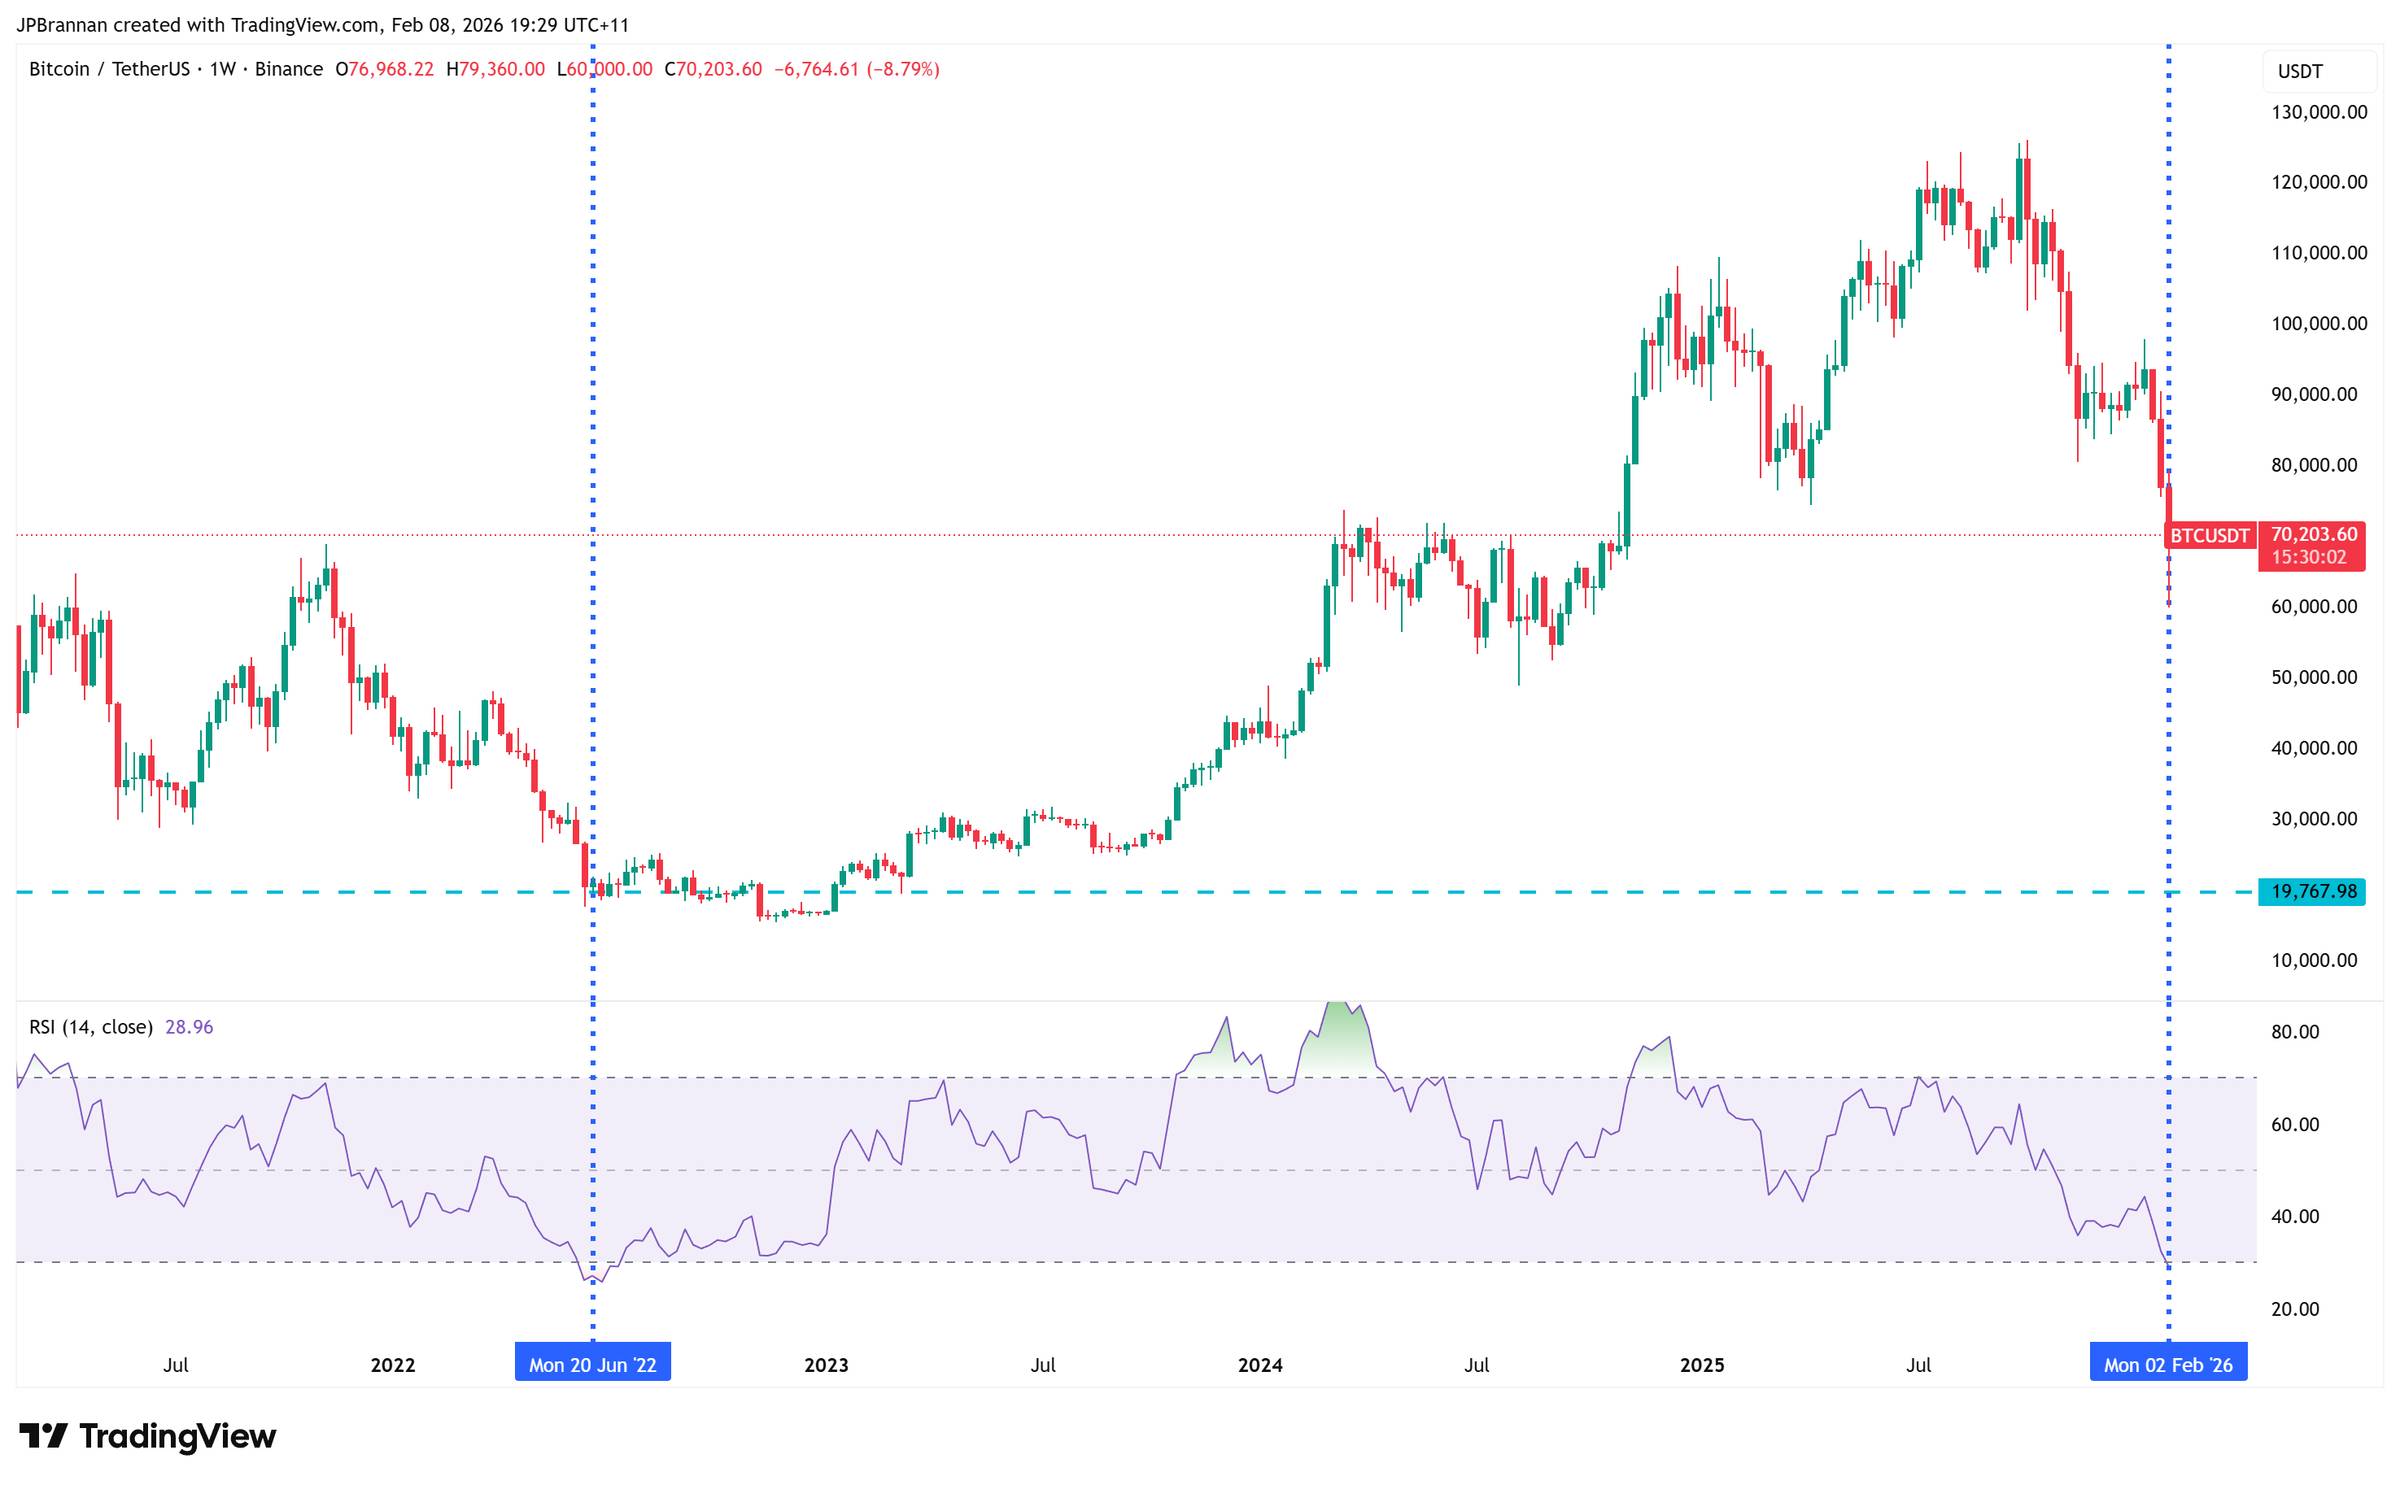
- From a technical standpoint, the RSI (relative strength index) signals oversold conditions while the upcoming Market Structure Bill remains the largest near-term catalyst for a large rally in digital asset prices
What Caused the Biggest Single Day Dollar Decline in Bitcoin's History?
Over the last week the digital asset market sold-off heavily as fear and panic-selling took ahold of investor mindsets. Bitcoin wicked down ~24% with prices briefly touching US $60,000 before rebounding toward US $69,000. In a single 24-hour period, bitcoin fell ~US $15,000, it's largest single day drop in history.
This week marked a significant ~52% (now 45%) drop from bitcoin's all-time high of US $126,000 seen in October as the 'Fear & Greed' index reached 8, the lowest point since the FTX exchange blow-up of 2022 and the COVID 2020 crash. Of course, other digital assets were not spared with ETH, SOL, XRP and BNB all falling between 22%-32% before recovering some ground.
What Drove the Sell-off?
At least part of the sell-off appears to have been driven by the market's hawkish interpretation of Trump's nomination for Chair of the Federal Reserve, Kevin Warsh. Warsh has been a vocal critic of the Fed's overly-stimulatory monetary policies - which for many gold, silver and bitcoin investors is the underlying thesis for price appreciation (more dollars in circulation = number goes up for scarce assets).
The drawdown however was more severe than most would have expected. While there's no confirmation yet, there are suggestions that a major Hong Kong-based hedge fund may have been margin called as trading on BlackRock’s bitcoin ETF surged to record levels during the crash, more than 2x the previous record at over US $10.7B in one day. While the company filings won't reveal the truth if there was a margin call on a major hedge fund for months, this certainly seems plausible given the magnitude and speed of the drawdown.

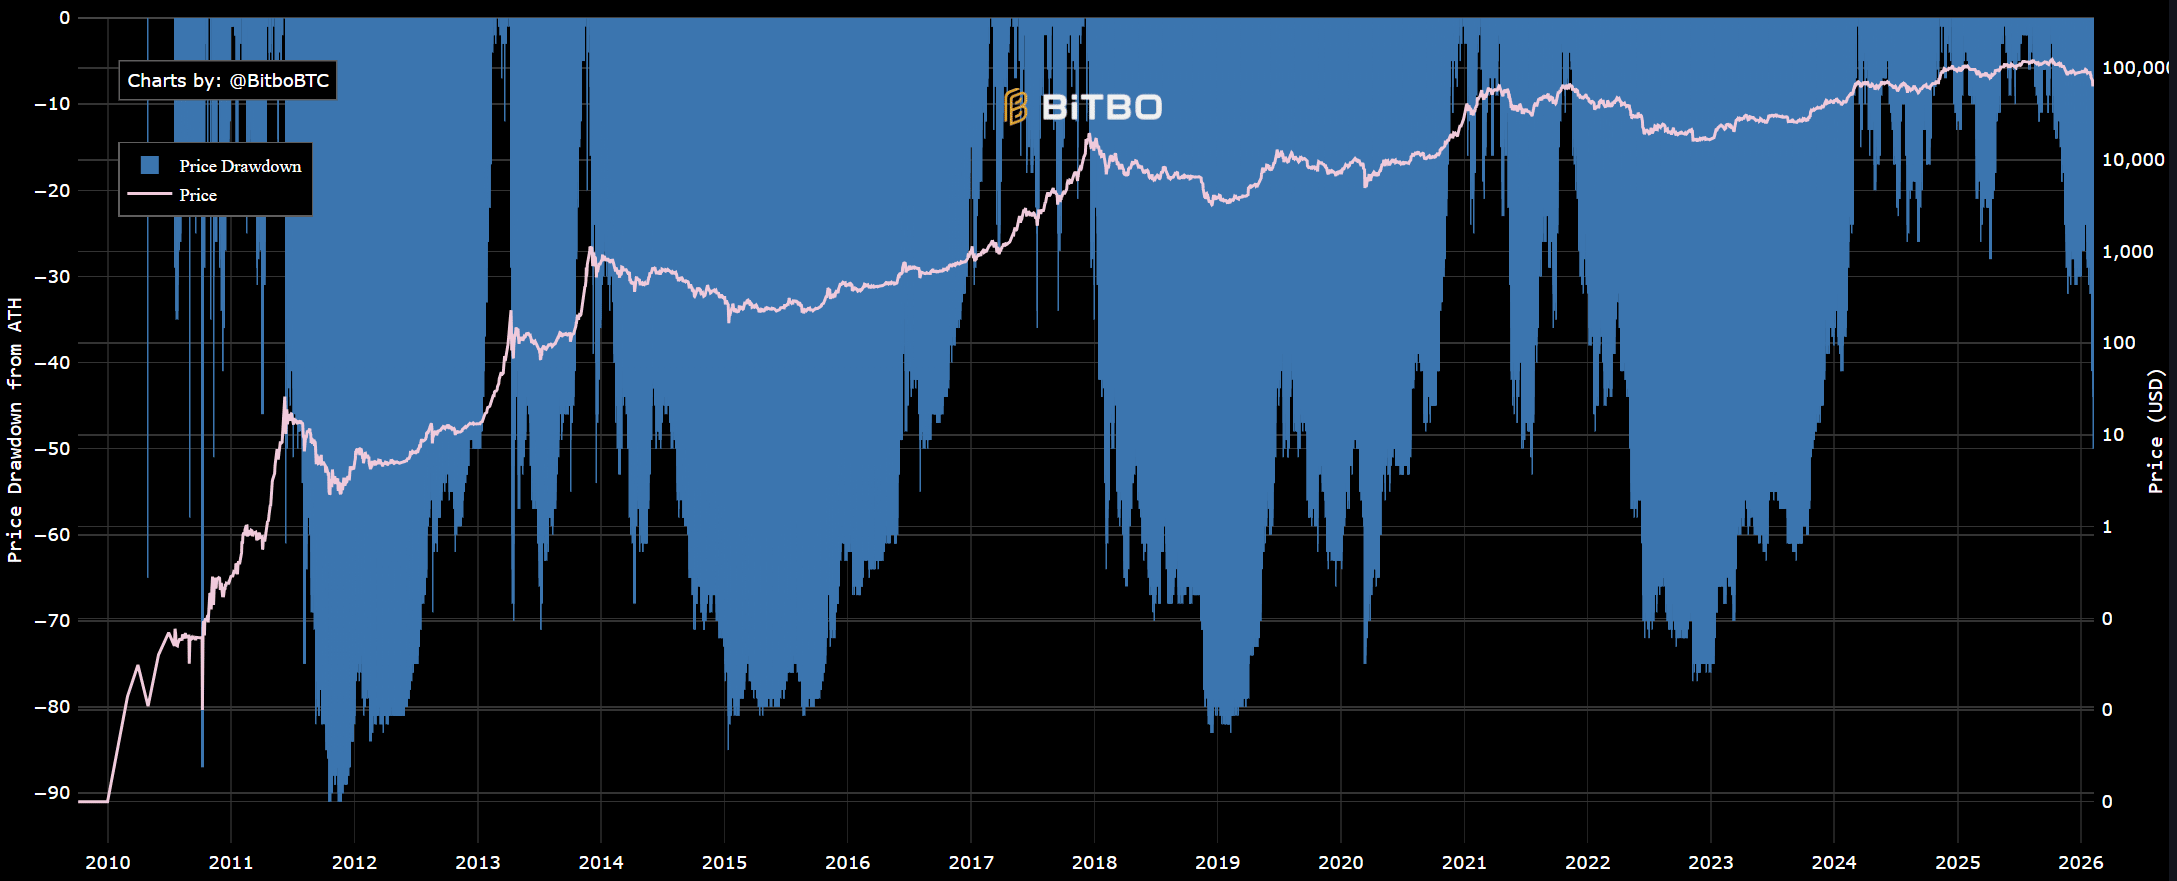
Taking a step back, it's important to acknowledge that digital assets are in a corrective phase and that volatility cuts both ways. It's not always up and to the right, and since bitcoin began trading in 2009, we've seen volatility decrease from 90%+ drawdowns to <70% and this cycle (so far) a -52% drawdown. While this doesn't necessarily make this pullbacks any more palatable, it is actually historically 'normal'.
My final thoughts on this week's pullback are inspired from the great Peter Lynch, though he was talking about equities, the parallels are clear. Every 6 years on average, the market goes through a 25% or more decline, and every 2 years the market declines by 10% or more. In crypto, there's a major pullback every 4-years, and with greater severity. As investors, we should expect these pullbacks, and for high quality assets, take these opportunities to lower our average entry price.
Are Treasury Companies Under Existential Threat
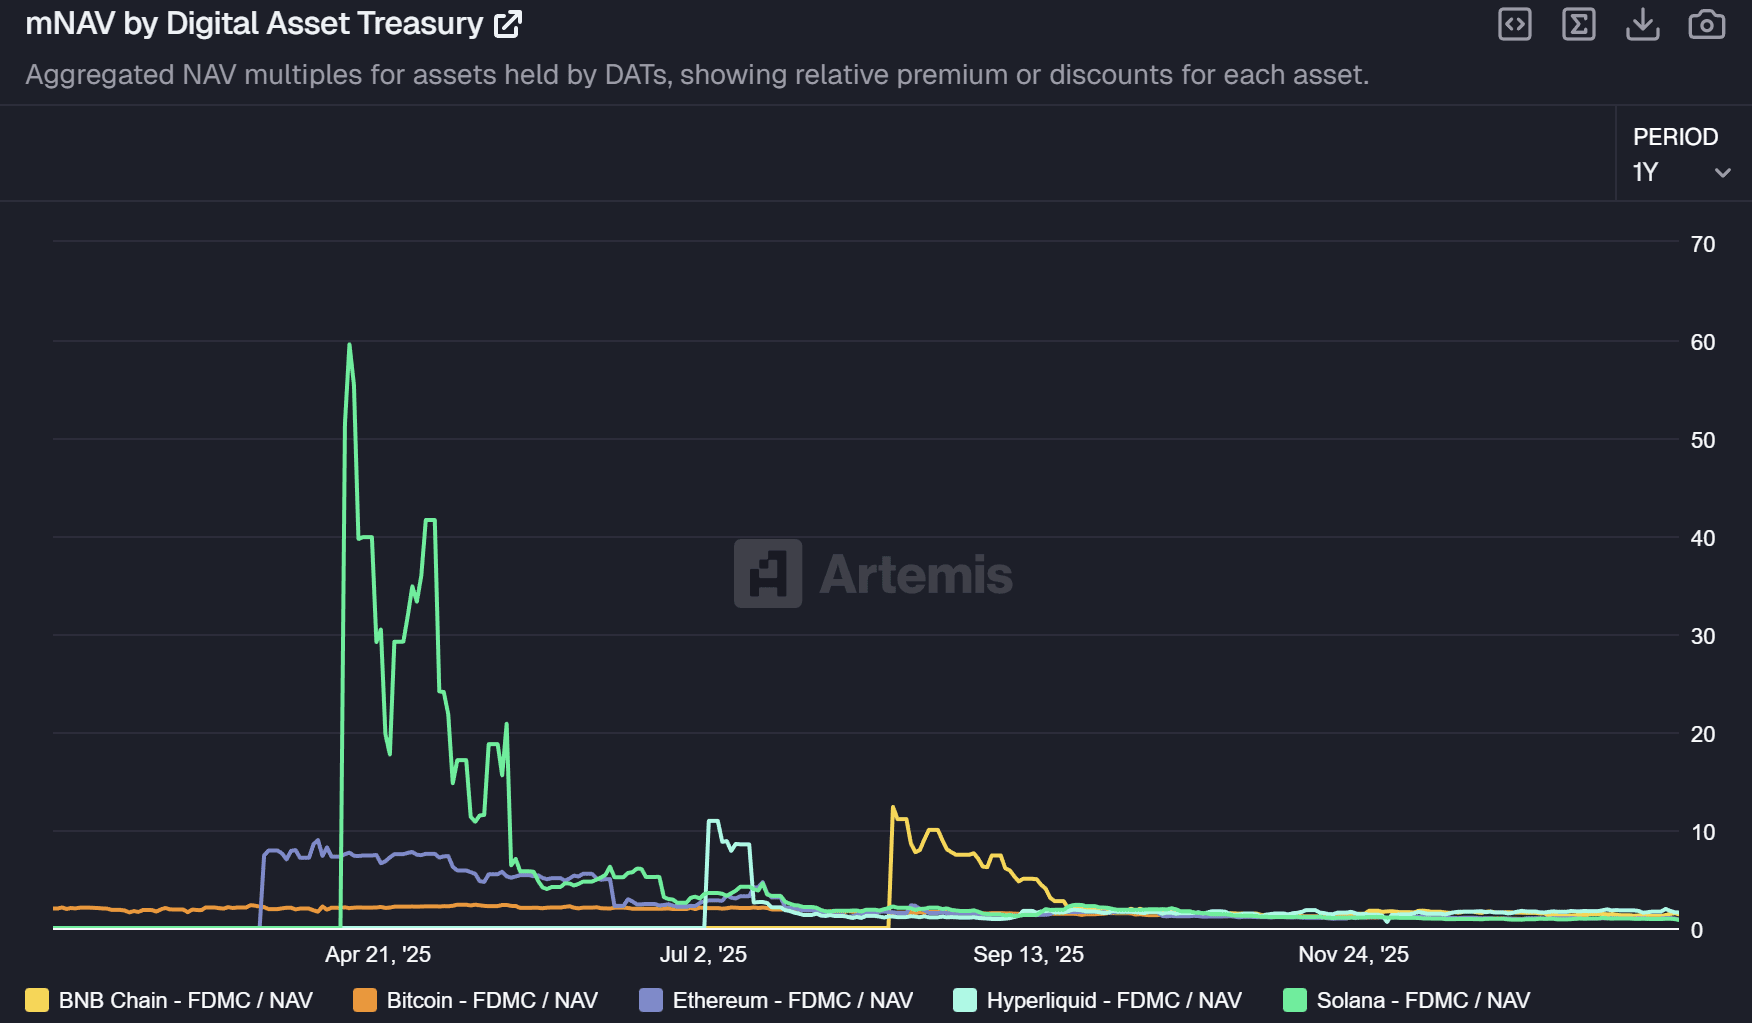
The recent market rout has put renewed scrutiny on corporate balance sheets with significant digital asset exposure, particularly Strategy and Bitmine. Over the last year, the multiple of net asset value (mNAV) paid for treasury companies has collapsed close to 1, meaning these firms are no longer trading at a premium to the underlying holdings.
Strategy reported a massive US $12.4B net loss fourth-quarter loss driven largely by non-cash mark-to-market accounting as bitcoin prices fell sharply. Wall Street analysts were quick to stress that the headline numbers do not signal a liquidity crisis. Strategy holds roughly 713,500 bitcoin, worth close to $50 billion at current prices, against approximately $8.2 billion in convertible debt and over $2 billion in cash. Importantly, none of its debt carries covenants tied to bitcoin’s price, reducing the risk of forced sales even in prolonged downturns.
BitMine, the largest ethereum treasury company is now sitting on an ~US $8B unrealised loss. BitMine’s position of 4.29M ETH, acquired at an average price of US $3,822, is currently valued at US $8.4B as Ether trades around the ~US $2,000 level. While these paper losses are substantial, the risk of forced liquidation for BitMine is also low. BitMine operates without debt covenants and earns recurring revenue via 2.9M staked ETH.
In summary, we don't foresee any near-term liquidation risks for either company which appear to be well captialised and have assets that significantly outweigh liabilities on their balance sheets with no forced liquidation mechanisms. As CEO of Strategy, Michael Saylor, said, 'the risk is in the equity, not the debt'.
Is The Bottom In?
While it's impossible to know the future, we can see on a relative basis whether we are currently 'oversold' or 'overbought'. To do that, we look at the Relative Strength Index (RSI) which looks at the average gains and losses over a period then provides a score from 0-100. Historically, when the RSI has dipped below 30, the bitcoin price has been either at or near the bottom of the market.
For investors holding large positions in altcoins (XRP, SOL, SUI, ETH), we continue to expect these assets to trade as more volatile proxies to bitcoin.
Market Structure Bill: The Near-Term Catalyst
Looking ahead, the most significant near-term catalyst for digital assets may be the Market Structure Bill (also called the CLARITY Act) legislation currently working its way through Congress. This bipartisan bill aims to establish clear regulatory guidelines for digital assets, addressing the longstanding uncertainty that has plagued the industry for years. If passed, the legislation would provide a comprehensive framework distinguishing between securities and commodities in the crypto space, establish clearer custody requirements, and potentially pave the way for broader institutional adoption in the US.
The bill is currently stalled as the banking lobby is fighting crypto native companies over their right to offer interest on client's stablecoin deposits. Bank of America CEO, Brian Moynihan, has said that as much as US $6T could leave the traditional banking system to the stablecoin economy if stablecoin yield is allowed. We continue to watch this development closely and expect the bill to pass in the coming months.
Until next week,
James
James Brannan
Managing Director, BlockByte